
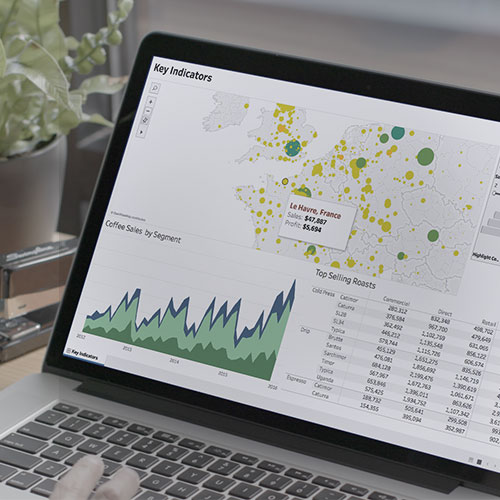
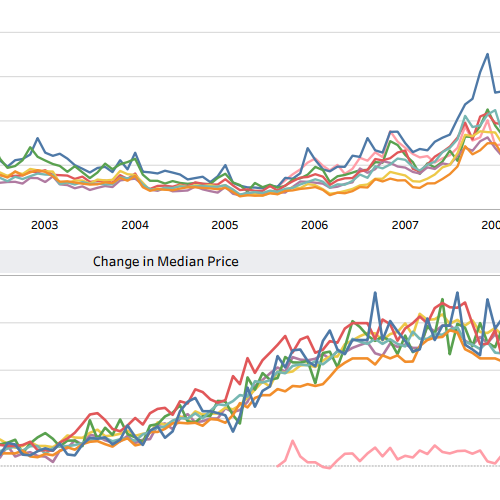
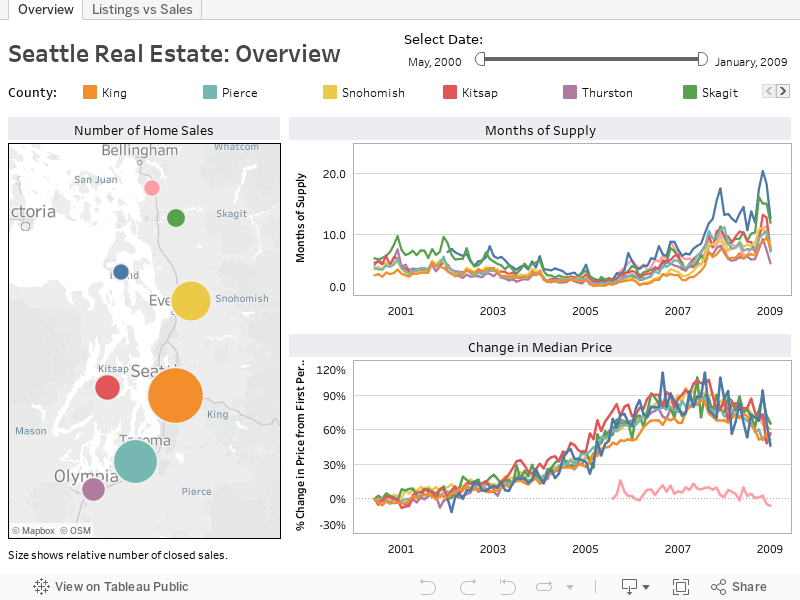
Incorporating maps into your analysis, reports and dashboards should be as common as creating another bar chart, pie graph or data table. Make maps part of your everyday analytical approach:
Perform detailed analysis using demographic data and built-in mapping capabilities
Present enormous countrywide datasets clearly and allow drill-down to local areas
Analyze geographical buying behavior based on product types
Identify and mitigate risk and efficiencies across geographies
Analyze revenue and profit by region
Full-version trial. No credit card required.

當我們拿著我們使用 Tableau 完成的第一個儀表板去與高階主管們進行第一次會議時,其中有幾個人都驚訝到說不出話來。其中一個主管表示:「我早就希望 BI 領域可以像這樣,現在他們終於辦到了。」