
Incorporating maps into your analysis, reports and dashboards should be as common as creating another bar chart, pie graph or data table. Make maps part of your everyday analytical approach:
Perform detailed analysis using demographic data and built-in mapping capabilities
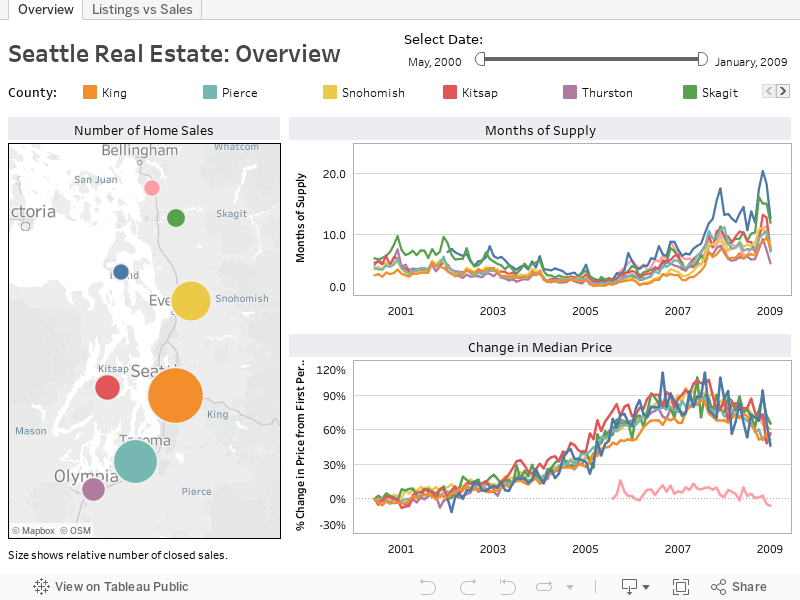
Present enormous countrywide datasets clearly and allow drill-down to local areas
Analyze geographical buying behavior based on product types
Identify and mitigate risk and efficiencies across geographies
Analyze revenue and profit by region
Full-version trial. No credit card required.

When we took the first dashboard done in Tableau to the first meeting with the executives, some were so surprised, that the reaction was mostly silence. One of the executives said, 'I always asked for that in the BI area and finally they managed to do it.'