
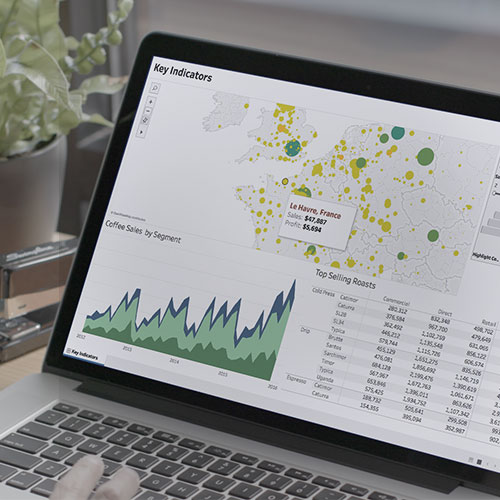
Incorporating maps into your analysis, reports and dashboards should be as common as creating another bar chart, pie graph or data table. Make maps part of your everyday analytical approach:
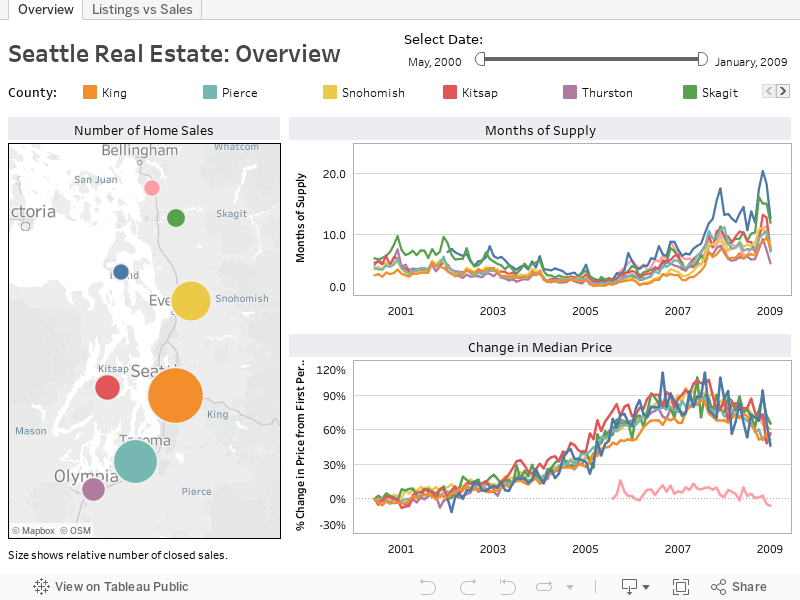
Perform detailed analysis using demographic data and built-in mapping capabilities
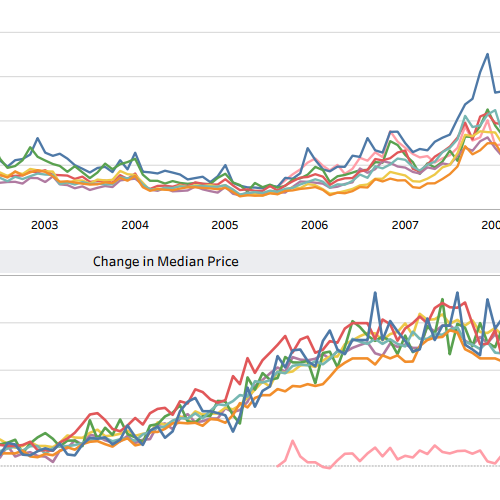
Present enormous countrywide datasets clearly and allow drill-down to local areas
Analyze geographical buying behavior based on product types
Identify and mitigate risk and efficiencies across geographies
Analyze revenue and profit by region
Full-version trial. No credit card required.

当我们第一次将 Tableau 制作的仪表板带到管理人员会议上展示时,许多人都惊讶得说不出话。一位管理人员说,‘这是我一直以来对 BI 领域的期望,他们最终做到了。’
媒体报道