Arby's maps retail success with Tableau
Arby's Restaurant Group, is the franchisor of the well-loved American, fast casual brand. When Arby’s Restaurant Group was renovating their chain of restaurants, they faced some questions. What happens to the customers when a restaurant closes for renovation? Where do they go? And do they come back when the restaurant reopens?
Prioritize your data strategy
With many new channels of commerce and innovative customer experiences emerging, the norms for retail business intelligence are evolving. These changes, driven by fast-moving technology and new visualization techniques, have lead to wholesale cultural change across the industry.
Competitive retailers must unlock real value from their data to make fast, complete business decisions. From loyalty programs and web analytics, to supply chain management and point-of-sale details, making sense of big data to find actionable insights is simply critical for success.
3 steps to turn retail data into profit
Retailers are awash in data, but to what benefit? Often, analytics built from this data overload can carry more noise than insight. This whitepaper explains how to avoid common retail analytics pitfalls and pinpoint the findings that can make your retail business more successful.
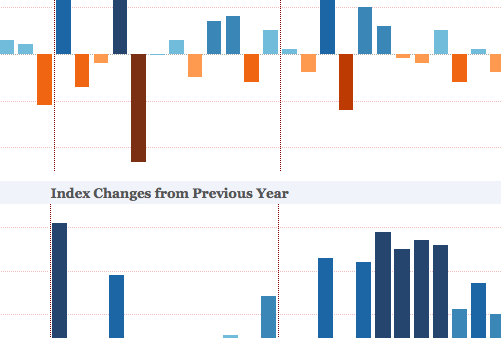
Customer distribution and sales
Different stores have different customers, and different customers demand different products. This visualization was designed to help make that easier by identifying trends among stores and finding the optimal product mix for each one.


5 charts every retailer should look at
Retailers are constantly using data to make critical decisions every day. But is the information being presented in the most effective format? Are there hidden sources of data retailers could be using, or even new ways of analyzing existing sources?
It increases our sales; it decreases our costs—there’s a direct impact. It just gets you insight faster. Of all the goals that you might have in your position, you can just accomplish them faster and better (with Tableau.) I think it has a huge, positive, rippling effect across the org.
Do your analytics tools slow you down or speed you up?
Whether you're measuring point of sale or comparing brand popularity, Tableau takes the pain out of retail analytics by allowing you to quickly and easily visualize your data—no scripting required. You can connect to almost any data, anywhere.
Watch the video on the right to see how easy it is to drag and drop your data into beautiful visualizations with Tableau.