Monitor all relevant production data from a single dashboard
Quality data is critically important but notoriously hard to compile. It often includes data from customers, machines and plants. Unlike other manufacturing BI tools that require database knowledge or IT experience, in Tableau you simply drag and drop to blend data in the same view. You can also combine multiple views on a dashboard to get the whole story on quality.
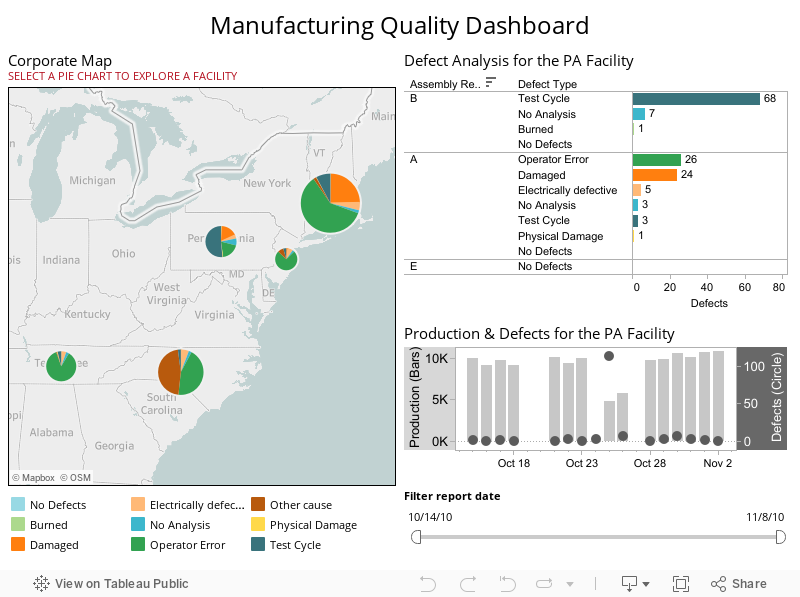
This manufacturing dashboard lets you choose a facility by clicking on the map. Then you can see detailed defect information for that facility in the top right view. In the lower right view you can see production (bars) and defects (circles) at that facility over time. Notice how high defect counts generally lead to lower production levels in the days immediately following the defect.