Find market trends first
Tableau is an easy visual environment that lets you answer questions about stocks, bonds, derivatives and funds, 10 to 100 times faster than you can with spreadsheets or statistics packages. It all happens in a simple workbook that any Excel user can quickly master.
With Tableau's Data engine, you can work with huge volumes of data such as intraday trading data and years of data for thousands of securities.
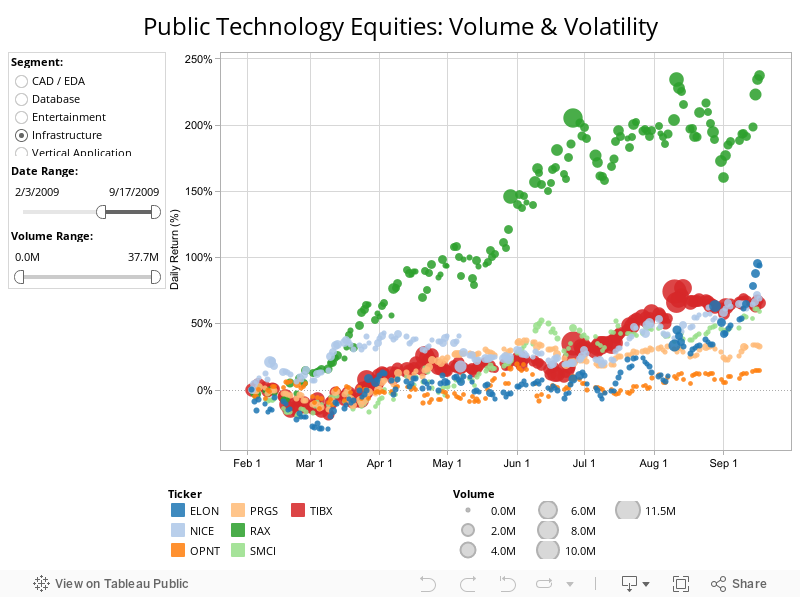
This dashboard lets you inspect the daily trading details of publicly traded technology stocks. Adjust the filters to examine a specific industry or to change the date range. You can identify those days with large trading volume (use the volume filter), or compare the return/ volume dynamics of different companies. This sector analysis application was created with Tableau’s drag and drop interface in minutes.