Do quantity on hand analysis from one dashboard
Analysis of quantities on hand (QOH) versus forecasted sales is a crucial aspect of an accurate supply chain. Tableau can help with the reporting, visualization, and forecasting by combining multi-dimensional views of your product chain.
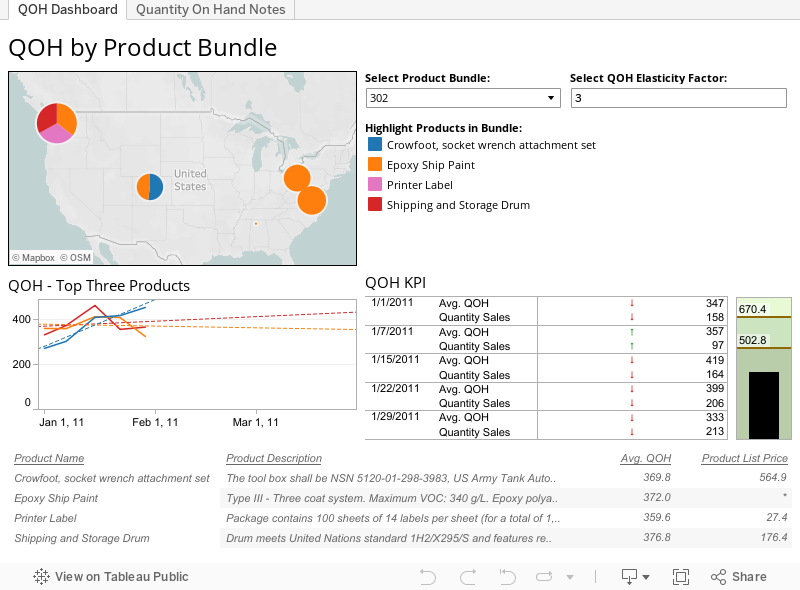
On this QOH dashboard there is a unified view into the product bundles that make up this supply chain. A manager can log into this dashboard and select a product bundle to see forecasted QOH trends and regional sales in one view.