DataFam Roundup: April 8–12, 2024


Welcome! Dig into this week's DataFam Roundup—a weekly blog that brings together community content all in one post. As always, we invite you to send us your content—and the DataFam content from your peers that have inspired you! Find the content submission form here.
Community Highlight
To recognize new and consistent Tableau contributors—we’re excited to have a section within the weekly DataFam Roundup called the Tableau Community Highlight. Find out how to get involved.

Anastasiia Stefanska, Data Analyst at TUI
Berlin, Germany
Anastasiia Stefanska is a Data Analyst at TUI. She first got started with Tableau after joining a startup in Berlin as a Data Analyst. She describes the beginning of her Tableau journey as “love at first sight” as she found that the tool filled a large gap in her efficiency as an analyst. She first started with free training videos from Tableau which later culminated into getting all five Tableau certifications.
Anastasiia enjoys sharing her knowledge through the Tableau Forums because of the level of detail that can be provided through answers and the power of support that is given. She is also involved in the Analytics Tableau User Group and the Berlin Tableau User Group.
On Tableau Public, Anastasiia is inspired mostly by her interests in calculus, trigonometry, mechanics, astrophysics, and geometry. She is also taking evening art classes to better understand composition and different styles.
DataFam content
Dive into content created by the Tableau Community:
Ray Givler: How to mentor someone in Tableau
-
Brittany Rosenau: I’m trying the 30 Day Chart Challenge — Here’s what I hope to get out of it
-
Louis Yu: Secrets of the Viz: What's Hokuriku?
-
Ayushi Gupta: A Comprehensive Guide to Building Interactive Dashboards in Tableau
-
Joy (Jhoie) Victor: Building Custom GPTs to Solve Data-Related Problems with Adam Mico
-
Sarah Bartlett: Tableau Conference 2024 – Know Before You Go
-
The Data Leadership Collaborative: Who Should the CDO Report to?
-
Dawn Harrington, TechTipsGirl: Can You Still Expand/Collapse Views in a Container with Dynamic Zone Visibility?
-
Deepak Holla:
-
Ray Givler: How to mentor someone in Tableau
-
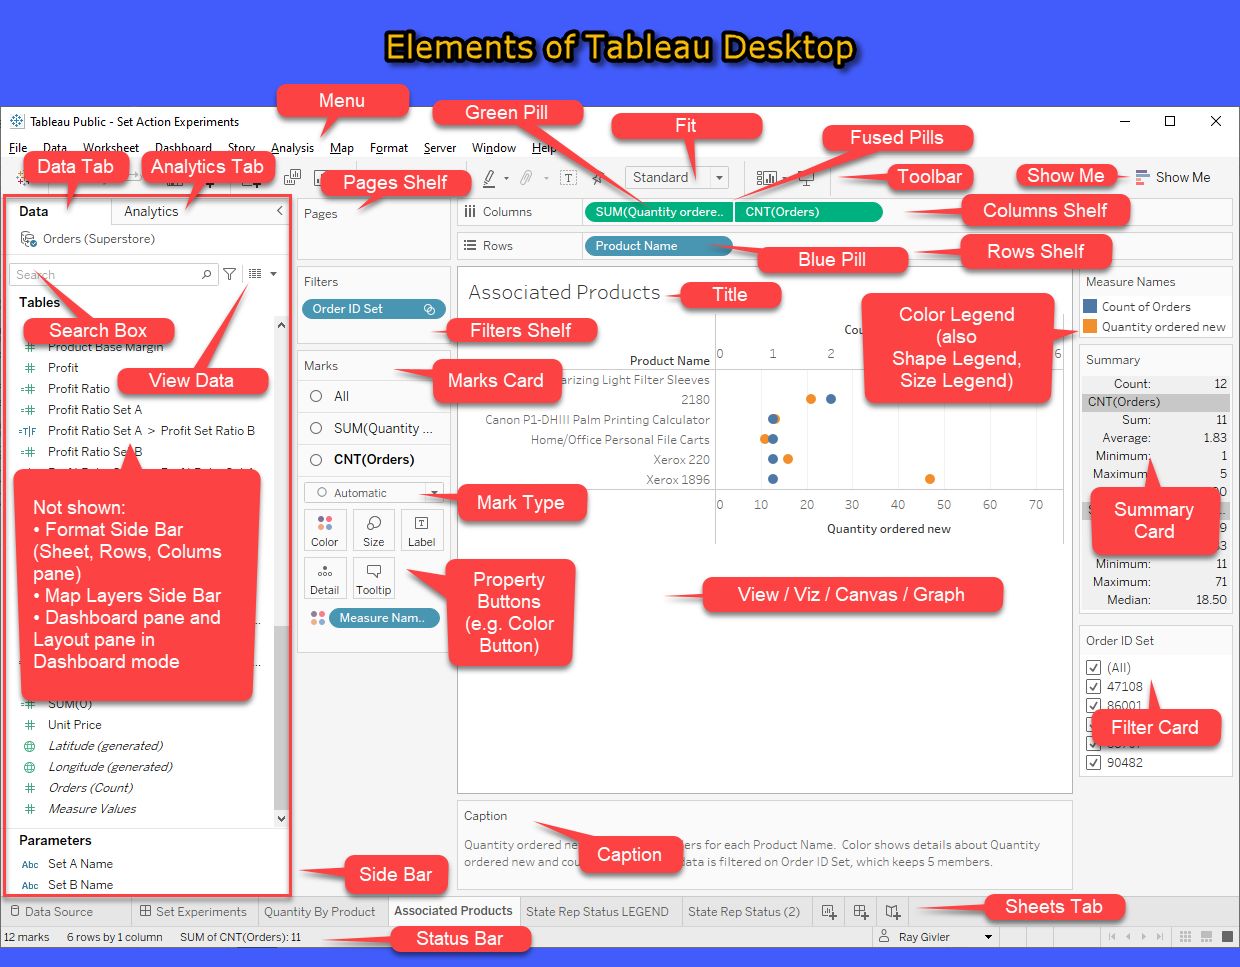
Action Analytics: Mental Model #8.1: Four Pill Types in Tableau
-
Shangruff Raina: Top Data Profile. What Suits you?
Team Tableau
Upcoming events and community participation
-
Lights, Camera, Action: Tableau and IMDb Launch Data Visualization Campaign for Movie Lovers
-
Free headshots at the Data + Women event at Tableau Conference 2024: Sunday, April 24, 2024 from 7:00pm-9:00pm at the San Diego Wine & Culinary Event Center. Register here!
Vizzes
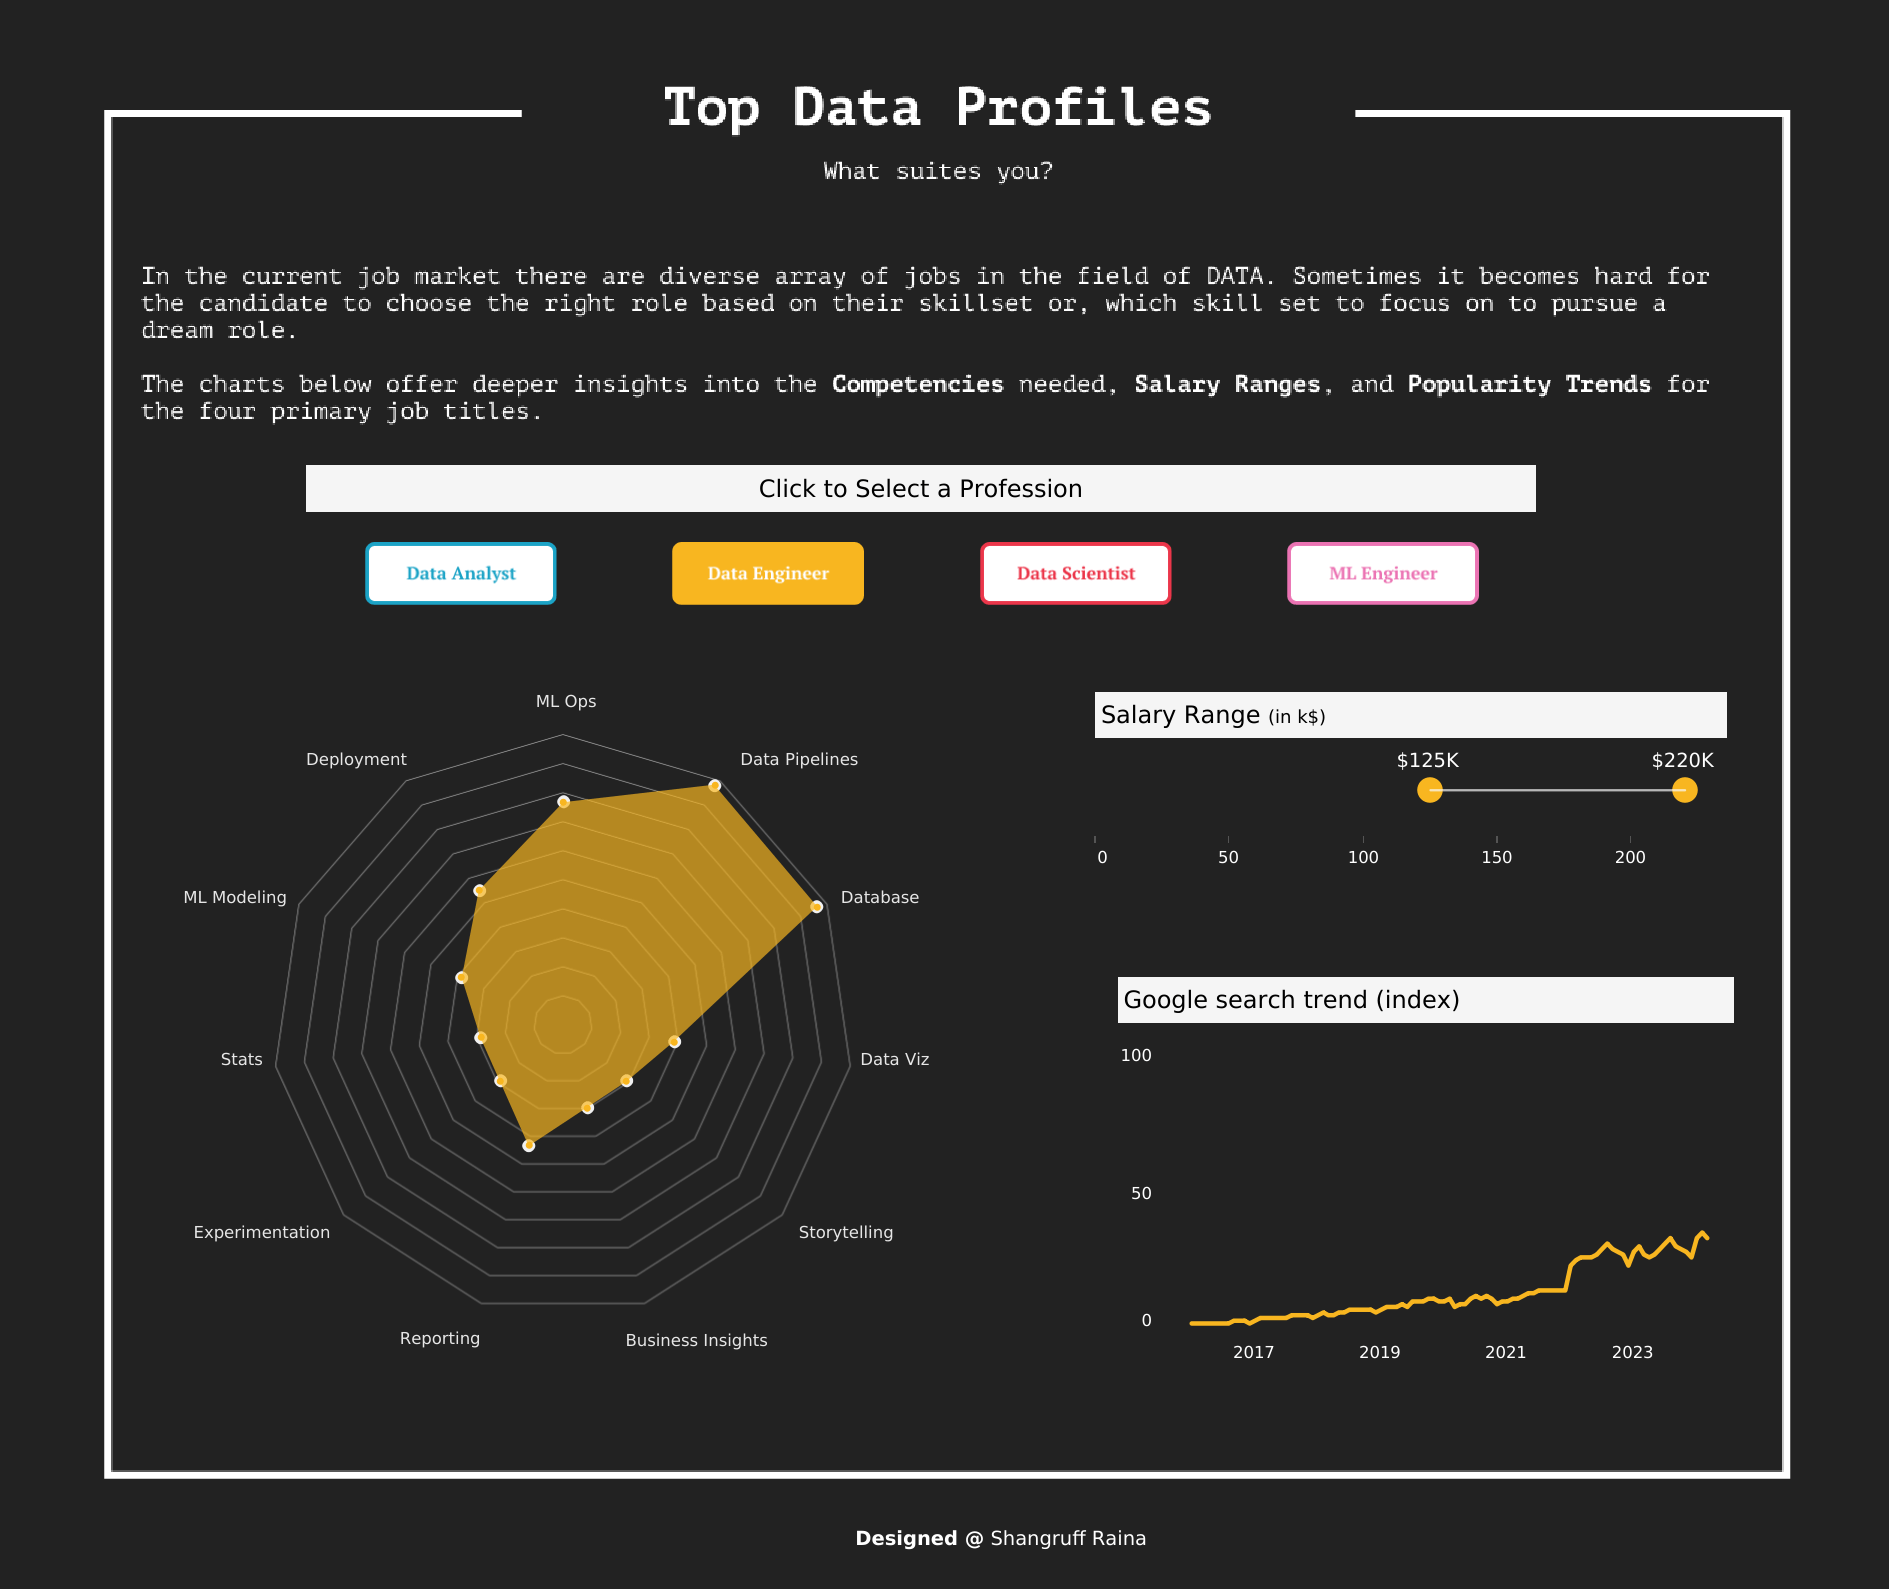
Shangruff Raina: Top Data Profile. What Suits you?
See the latest Viz of the Day, trending vizzes, featured authors, and more on Tableau Public.
Check out some inspirational vizzes created by the community:
-
Lisa Trescott: San Diego Attractions
-
Jaroslav Tomcala: Easter Eggs
-
Ray Givler:
-
Sherzodbek Ibragimov:
-
Anna Mandoki: Wonders of the World #B2VB
-
Shangruff Raina: Top Data Profile. What Suits you?
-
Waqar Ahmed Shaikh: Visualizing The S&P 500 Landscape
Community Projects
Recreations of W.E.B Dubois's Data Portraits
Recreations of W.E.B Dubois's Data Portraits
Web: W.E.B. Dubois's Data Portraits
Twitter: #DubiosChallenge
Back 2 Viz Basics
A bi-weekly project helping those who are newer in the community and just starting out with Tableau. Not limited just to newbies!
Web: Back 2 Viz Basics
Twitter: #B2VB
Week 7: Build a Symbol Map
Workout Wednesday
Build your skills with a weekly challenge to re-create an interactive data visualization.
Web: Workout Wednesday
Twitter: #WOW2022
Week 15: Can you create a (super) dynamic trellis chart?
Preppin' Data
A weekly challenge to help you learn to prepare data and use Tableau Prep.
Web: Preppin’ Data
Twitter: #PreppinData
Week 15: Store Data Part 2
DataFam Con
A monthly challenge covering pop culture and fandoms.
Web: DataFam Con
Twitter: #DataFamCon
March 2024 Challenge: Sports Movies Edition
Makeover Monday
Create business dashboards using provided data sets for various industries and departments.
Web: Makeover Monday
Twitter: #MakeoverMonday
Week 15: The Conservatives’ economic record since 2010 in 10 charts
EduVizzers
A monthly project connecting real education data with real people.
Web: Eduvizzers
April 2024: School Bullying
Viz for Social Good
Volunteer to design data visualizations that help nonprofits harness the power of data for social change.
Web: Viz for Social Good
Twitter: #VizforSocialGood
March 15 - April 19, 2023: Visualizing the Social Impact of Viz for Social Good
Games Night Viz
A monthly project focusing on using data from your favorite games.
Web: Games Nights Viz
Twitter: #GamesNightViz
Season 2: With great power comes great vizzes
Iron Quest
Practice data sourcing, preparation, and visualization skills in a themed monthly challenge.
Web: Iron Quest
Twitter: #IronQuest
Women
Storytelling with Data
Practice data visualization and storytelling skills by participating in monthly challenges and exercises.
Web: Storytelling with Data
Twitter: #SWDChallenge
April 2024: Napoleon's April
Project Health Viz
Uncover new stories by visualizing healthcare data sets provided each month.
Web: Project Health Viz
Twitter: #ProjectHealthViz
October 2023: Customizing Shapes with Opacity in Tableau
Diversity in Data
An initiative centered around diversity, equity & awareness by visualizing provided datasets each month.
Web: Diversity in Data
Twitter: #DiversityinData
November 2023: Disney Demographics
Sports Viz Sunday
Create and share data visualizations using rich, sports-themed data sets in a monthly challenge.
Web: Sports Viz Sunday
Twitter: #SportsVizSunday
Real World Fake Data
Create business dashboards using provided data sets for various industries and departments.
Web: Real World Fake Data
Twitter: #RWFD
2024 - Admin Insights
Data Plus Music
A monthly project visualizing the data behind the music we love!
Web: Data Plus Music
Twitter: #DataPlusMusic
Related Stories
Meet Iron Viz 2024 Finalist Chris Westlake
 April 22, 2024
DataFam Roundup: April 15–19, 2024
 April 19, 2024

Meet Iron Viz 2024 Finalist Jessica Moon
April 15, 2024
Subscribe to our blog
Get the latest Tableau updates in your inbox.