Easy Excel Graph Templates

Try Tableau for Free

Full-version trial. No credit card required.

See for yourself how speed, scale, and innovation come standard with Tableau.

Fast Analytics

Connect and visualize your data in minutes. Tableau is 10 to 100x faster than existing solutions.

Ease of Use

Anyone can analyze data with intuitive drag & drop products. No programming, just insight.

Big Data, Any Data

From spreadsheets to databases to Hadoop to cloud services, explore any data.
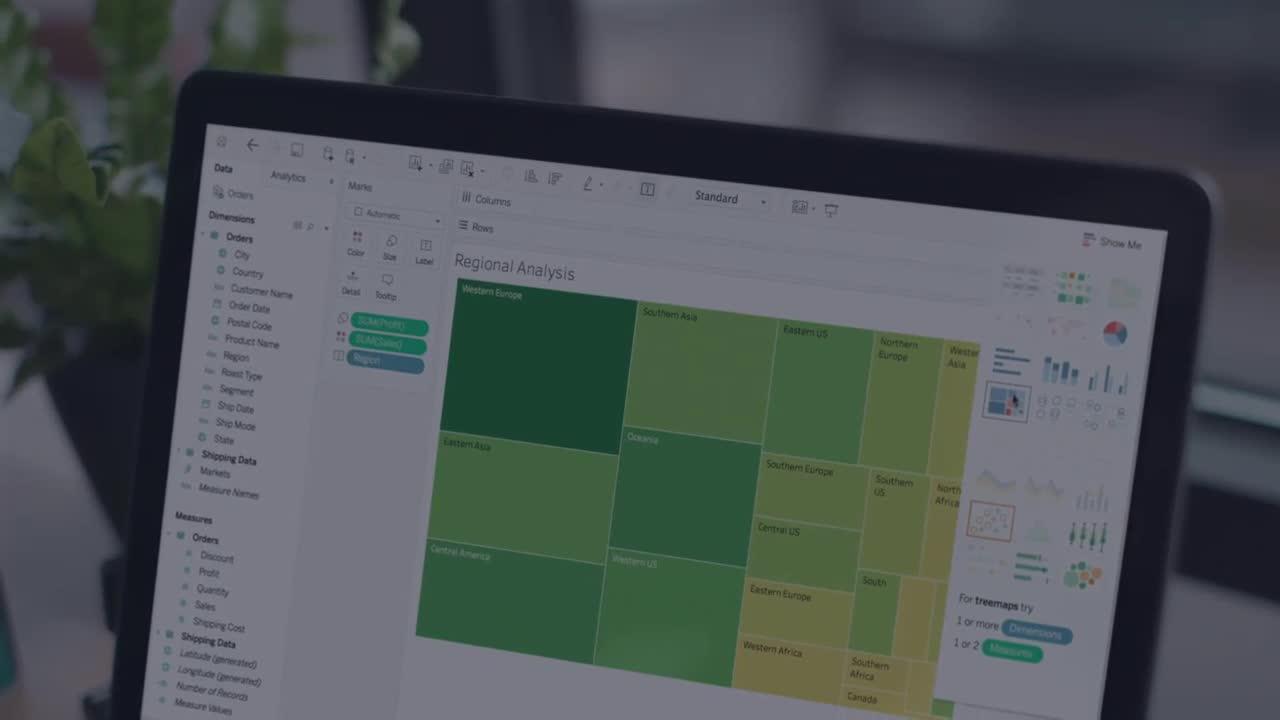
Smart Dashboards

Combine multiple views of data to get richer insight. Best practices of data visualization are baked right in.

Update Automatically

Get the freshest data with a live connection to your data or get automatic updates on a schedule you define.

Share in Seconds

Publish a dashboard with a few clicks to share it live on the web and on mobile devices.

Excel is everywhere. It's the go-to analysis tool and spreadsheet software for many business users. With Tableau, it is even more powerful. With a drag-and-drop approach to visual analysis, Tableau makes exploring Excel data faster and easier. You can ask and answer questions as you go, instead of running separate reports or cross-tabs for every question. Tableau visualizations are interactive and highly shareable, helping everyone in your business get answers.

Tableau natively connects to Excel spreadsheets to make data analysis fast and simple. Tableau allows Excel users to keep their spreadsheets, while greatly enhancing their ability to analyze their data, all while delivering simple-to-build and simple-to-read visualizations that convey information clearly.

Make your data better

This visualization shows the number of endangered species listed in Africa, but the animals themselves are lost in the story.

What different kind of visualization will tell the most truthful story, and best answer the questions at hand?


TRY TABLEAU FOR FREE

Full-version trial. No credit card required.

Afficher les caractéristiques techniques

Caractéristiques techniques


Systèmes d'exploitation
  • Windows 7 ou version ultérieure
  • OS X version 10.10 ou ultérieure

Environnements virtuels
  • VMWare | Citrix | Hyper-V | Parallels
  • Les produits Tableau fonctionnent dans des environnements virtualisés lorsque ceux-ci sont configurés avec le système d'exploitation et le matériel sous-jacents adéquats.

Internationalisation
  • Nos produits prennent en charge Unicode et sont compatibles avec des données stockées dans toutes les langues. L'interface utilisateur et la documentation sont en anglais, français, allemand, espagnol, portugais brésilien, japonais, coréen et chinois simplifié.

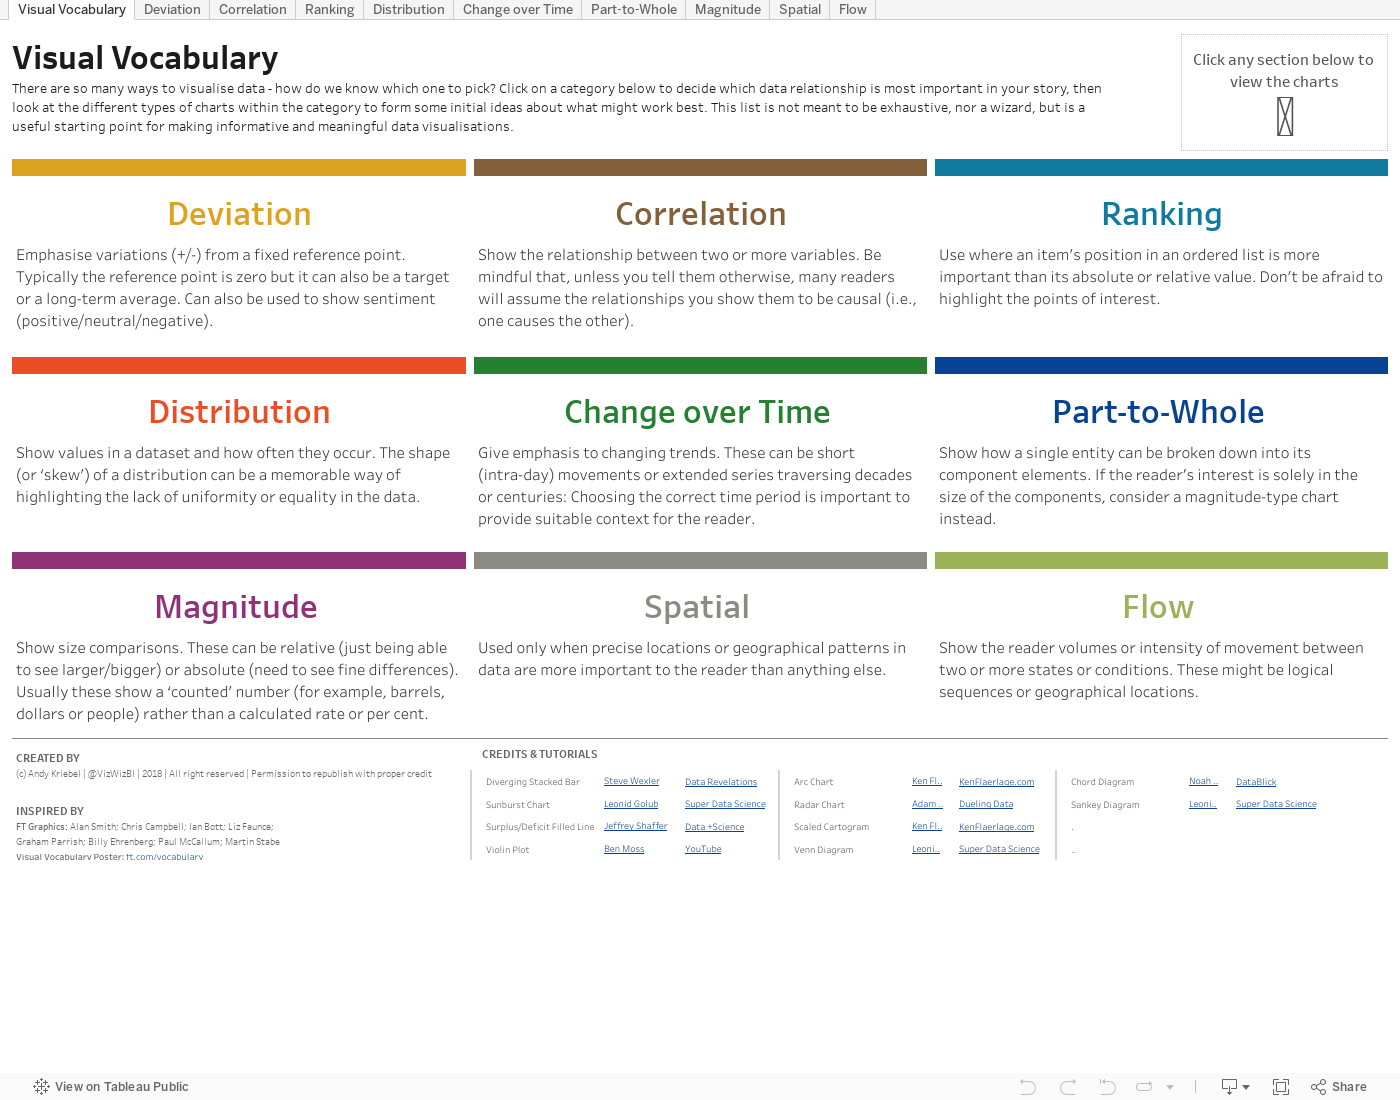
Explore your data with a purpose

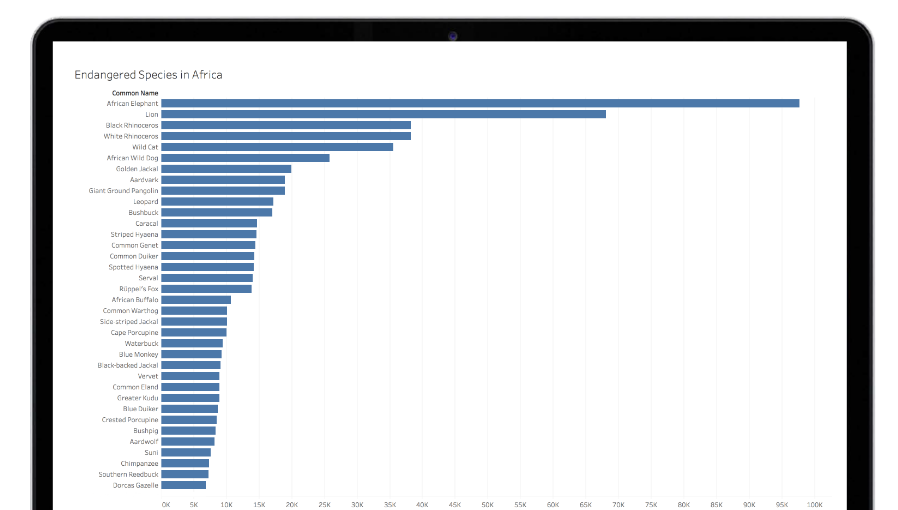
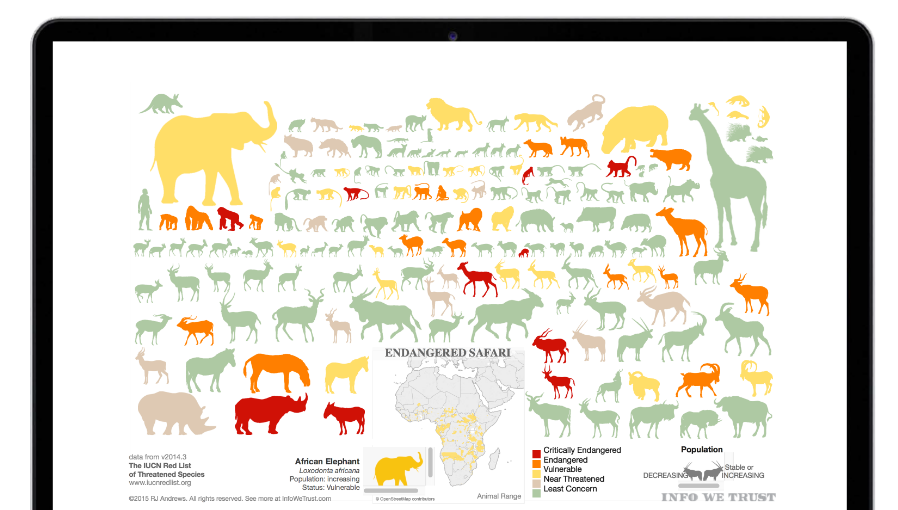
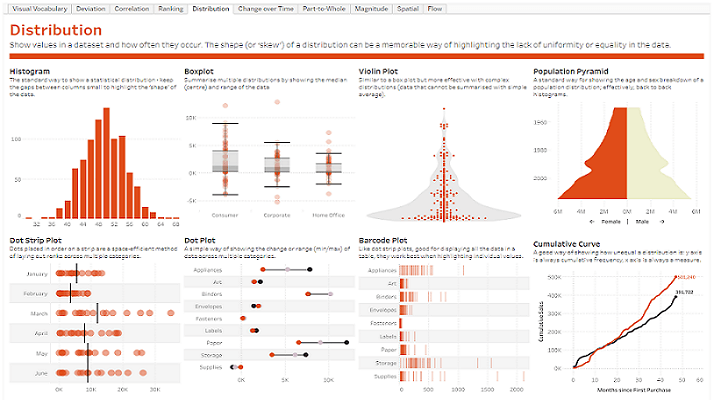
Data visualization is a form of visual art that grabs our interest and keeps our eyes on the message. When we see a chart, we quickly see trends and outliers.

If we can see something, we internalize it quickly. If you’ve ever stared at a massive spreadsheet of data and couldn’t see a trend, you know how much more effective a visualization can be.

Try Tableau for Free

Before it was always numbers in rows and columns. Now I’m eager to see when I do a new analysis, because it's so much easier to actually see the trends, the story, and the power the data brings.

À propos de Tableau

Tableau vous aide à transformer vos données en informations exploitables. Découvrez des possibilités d'analyse visuelle illimitées. Créez des tableaux de bord et effectuez des analyses ad hoc en seulement quelques clics. Partagez vos documents de travail avec les personnes de votre choix et marquez les esprits dans votre entreprise. Des grandes multinationales aux startups naissantes en passant par les TPE, tout le monde utilise Tableau pour voir et comprendre ses données.


Cité dans

Get Your Free Trial

Remplissez le formulaire pour commencer votre essai gratuit. Notre équipe vous contactera pour vous aider à tirer le meilleur parti de votre essai.

Vous avez déjà un compte? Connectez-vous ici
Adresse