DataFam Roundup January 2026


Welcome! Dig into this month's DataFam Roundup—a monthly blog that brings together community content all in one post. As always, we invite you to send us your content—and the DataFam content from your peers that have inspired you! To send us your content, join the Tableau Community workspace on Slack and join the #community-share channel.
Community Highlight
To recognize new and consistent Tableau contributors—we’re excited to have a section within the monthly DataFam Roundup called the Tableau Community Highlight. Find out how to get involved.

Karrie Cardiff, Manager Enterprise Data & Business Intelligence
Kirkland, WA
Karrie Cardiff is an Enterprise Data & Business Intelligence Manager. At work, she leads a team that builds enterprise-level dashboards to drive actionable insights; at home, she uses Tableau to track everything from personal finances to Taylor Swift’s tour costumes. Her journey began as a self-taught analyst, fueled by an early organizational adoption of Tableau. She rapidly upskilled by immersing herself in challenges like Workout Wednesday and Makeover Monday, as well as attending Tableau User Groups and following Community Leaders of the DataFam.
Today, Karrie is active in the Tableau Community, driven by what she calls its "secret sauce"—the selfless, helpful nature of the DataFam. She serves as a co-leader for the Seattle Tableau User Group, where she fosters a space for local networking and skill-building, while also mentoring others through an internal data viz center of excellence. Looking ahead, Karrie remains committed to continuous learning, aiming to master advanced features like Dynamic Zone Visibility and map layers, all while continuing to publish content on Tableau Public.
Connect with Karrie on Linkedin and Tableau Public.
DataFam Content
- Dan Chissick: DataFam Europe 2025
- Matt Huff: Makeover Monday: Become an Analytics Expert
- Rod Sardari: Upgrading Tableau Server: Step-by-Step Guide Using the Blue/Green Approach
- Sandeep Mandal: Workbook Metadata Extrator
- Gurpreet Singh: Ask Your Tableau Data Questions in Plain English | Claude + MCP Tutorial
- Jim Dehner: Custom Color Palettes
- Tanner Ladd: Why Row-Level Security in Tableau Matters (Part 1)
- Fiona Crocker: Best Way to Learn Tableau? My Next Level Tableau Course Review for Data Visualisation & BI
- Ojoswi Basu: Working with Containers
- Nicole Mark:
- Fiona Gordon, Sarah Burnett, Kirk Munroe:
- Deepak Holla:
- Say Hello to the Story || #Tableau "Say Hello" Series
- Tableau Basic Terminology: What are Controls?
- Creating Custom Color Palettes directly in Tableau
- How to carry out an Union in the Input Step of Tableau Prep Builder
- The Metadata Grid in Tableau Desktop is equivalent to the List View in Tableau Prep Builder
- Sharing Insights: Create and modify a dashboard
- Tarun Gupta:
- Tableau Next Tips #3: Understanding the Cost Behind Tableau Next Features
- Tableau Next Tips #4: Features — What You Can and Can’t Do
- Tableau Next Tips #5: Tableau Next Glossary
- Tableau Next Tips #6: Tableau Next REST API – Everything You Need to Get Started
- Tableau Next Tips Blog Series 9 - Tableau Next Setup Guide EP-00
Team Tableau Content
- Registration for Tableau Conference 2026 is open! Join us in San Diego May 5-7, 2026!
- Tune in to the Iron Viz 2026 Qualifier Results on Wednesday, February 4 at 9 a.m. PT
- Tableau 2026.1 is coming soon
- Tableau Chief Product Officer, Southard Jones: Ending Semantic Drift: The First Unified Business Logic Foundation for AI and BI
- Inside Track on Tableau 2026.1
Visualizations
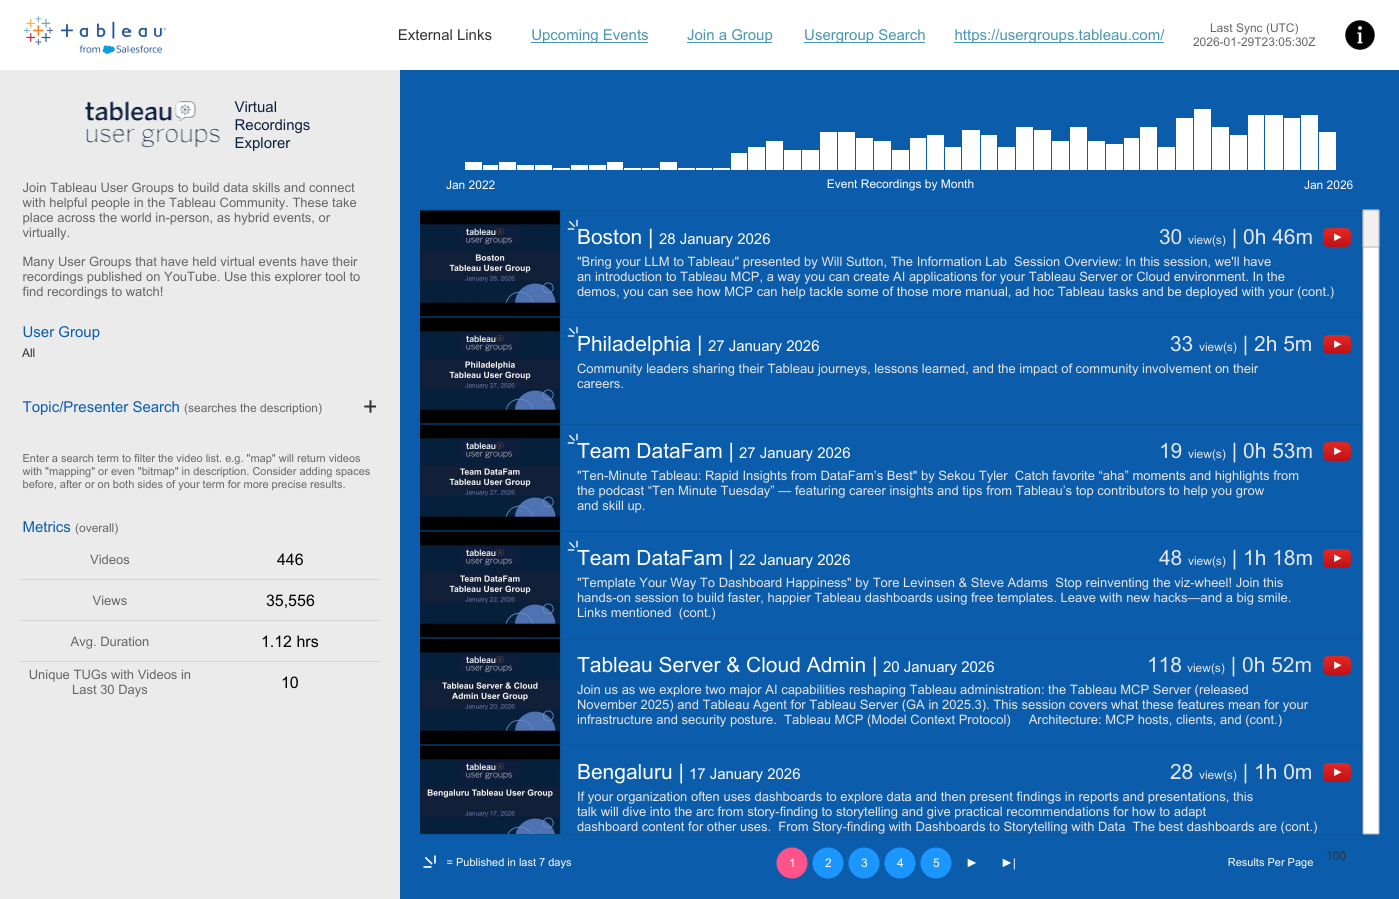
Jacob Rothemund: Tableau User Groups Virtual Recordings Explorer
See the latest Viz of the Day, trending vizzes, featured authors, and more on Tableau Public.
Check out some inspirational vizzes created by the community:
- Devon Ngo: Tallest Roller Coaster Drops | #MakeoverMonday 2026 W1
- Bill Chen: 2026 年曆 (Calendar 2026)
- Rafael Guevara: Juan Gabriel: Emotion, Sound, and Legacy
- Brittany Rosenau: 2026 Visionary Nominations
- Rob Chisholm: RMS Titanic: Survival by Class and Subsequent Outcomes
- Heather Cox: Into Every Generation a Slayer is Born
- Ojoswi Basu:
Community Projects
Back 2 Viz Basics
A bi-weekly project helping those who are newer in the community and just starting out with Tableau. Not limited just to newbies!
Web: Back 2 Viz Basics
X: #B2VB
Workout Wednesday
Build your skills with a weekly challenge to re-create an interactive data visualization.
Web: Workout Wednesday
X: #WOW2022
Preppin' Data
A weekly challenge to help you learn to prepare data and use Tableau Prep.
Web: Preppin’ Data
X: #PreppinData
Makeover Monday
Create business dashboards using provided data sets for various industries and departments.
Web: Makeover Monday
X: #MakeoverMonday
Data ChangeMakers
Volunteer to design data visualizations that help nonprofits harness the power of data for social change.
Web: Data ChangeMakers
Visual Climate
Collaborate and share climate data.
Web: Visual Climate
X: #VisualClimate
DataFam Con
A monthly challenge covering pop culture and fandoms.
Web: DataFam Con
X: #DataFamCon
EduVizzers
A monthly project connecting real education data with real people.
Web: Eduvizzers
Games Night Viz
A monthly project focusing on using data from your favorite games.
Web: Games Nights Viz
X: #GamesNightViz
Iron Quest
Practice data sourcing, preparation, and visualization skills in a themed monthly challenge.
Web: Iron Quest
X: #IronQuest
Storytelling with Data
Practice data visualization and storytelling skills by participating in monthly challenges and exercises.
Web: Storytelling with Data
X: #SWDChallenge
Project Health Viz
Uncover new stories by visualizing healthcare data sets provided each month.
Web: Project Health Viz
X: #ProjectHealthViz
Diversity in Data
An initiative centered around diversity, equity & awareness by visualizing provided datasets each month.
Web: Diversity in Data
X: #DiversityinData
Sports Viz Sunday
Create and share data visualizations using rich, sports-themed data sets in a monthly challenge.
Web: Sports Viz Sunday
X: #SportsVizSunday
Real World Fake Data
Create business dashboards using provided data sets for various industries and departments.
Web: Real World Fake Data
X: #RWFD
Data Plus Music
A monthly project visualizing the data behind the music we love!
Web: Data Plus Music
X: #DataPlusMusic
BizViz52
A weekly project centered around designing business dashboards.
Web: BizViz52
X: #BizViz52
Historias relacionadas

DataFam Roundup June 2026

DataFam Roundup May 2026

Iron Viz 2026: Read Between the Data
 28 Mayo, 2026