How Instacart implemented HyperLogLog in Redshift and Tableau to calculate distinct counts 50 times faster


Editor's note: Today’s guest blog originally appeared on the Engineering at Instacart blog.
At Instacart, we use Tableau for key performance indicator (KPI) reporting, KPI trending, and determining drops or spikes in our core metrics across key dimensions. In an effort to help the team be more efficient and data-driven in their day-to-day responsibilities and tasks, we also use Tableau to democratize our data by providing curated extracts for advanced data exploration. In the trade-off between flexibility and performance, we have chosen to create data extracts that are very granular instead of building aggregated data sources. Aggregated data sources are far more performant but limit the diversity of possible analyses.
Because our data volume is scaling much faster than we anticipated, this trade-off has recently started to degrade the load times of many of our dashboards (from a few seconds to around 20–30 seconds every time a filter is applied). We learned one of the root causes for this slow-down was metrics that included distinct counts. Since these metrics are required for unaggregated data sources, we started exploring alternatives to improve our Tableau performance.
We implemented HyperLogLog, a probabilistic counting algorithm, to create data extracts in Tableau. This post describes how to create a data source from a Redshift cluster (other data warehouses will work as well) and the associated measure definitions to implement HyperLogLog in Tableau with a quick toy problem that compares its performance to a measure including a distinct count.
HyperLogLog Algorithm
HyperLogLog is an algorithm that estimates the number of distinct elements in a data set with an acceptable error rate of 1.6% (using 4096 registers). The algorithm has been described in detail in many places and is fairly straightforward, so I will only discuss it at the very highest level (a more detailed explanation of the algorithm can be found here and a corresponding simulation here).
In HyperLogLog, elements of the the set are first hashed to ensure randomness, then converted into binary and added into a register. A register stores the most unlikely event observed in the set by observing the longest consecutive count of leading zeros. Based on the register’s maximum value, an approximate count of distinct elements can be calculated.
The table below demonstrates the likelihood of observing a given number of leading zeros in a register, given the binary representation (limited to eight bits for simplicity) of an element in the total set:
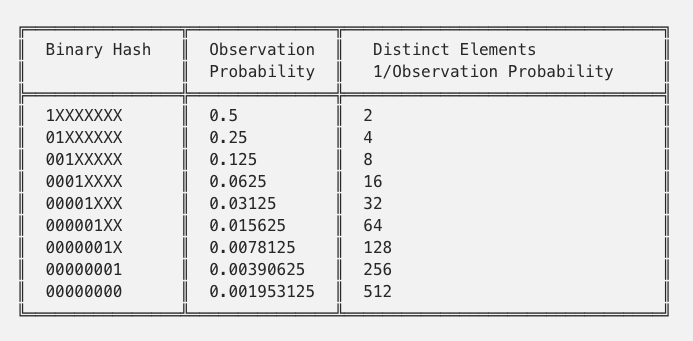
For example, if the longest run of zeros was four, we would estimate 32 elements.
Since this estimation can be heavily influenced by just randomly getting a long run of zeros, the total set of elements is split into many registers and averaged in order to estimate the total number of distinct elements. If our data were split into two registers, and the first had a maximum of four leading zeros while the second had only three leading zeros, we would estimate a cardinality of (32+16)/2 = 24. A final adjustment to this estimate is necessary to account for the possibility of hash collisions. This adjustment factor is defined by Flajolet et al. in their original HyperLogLog papers [10.1.1.76.4286] as:

Hash collision adjustment factor
where m is the total number of registers. Additionally, in order to minimize the impact of outliers, HyperLogLog uses the harmonic mean instead of a regular average, which gives us the following formula:
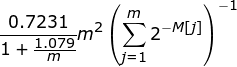
HyperLogLog cardinality formula
Where M[j] is the position of the first non-zero value in the register m.
Implementing HyperLogLog in Redshift
The challenge of preparing a data extract for Tableau now lies in recreating some of these non-standard operations in Tableau, and then storing the resultant registers in Tableau where they can be combined to determine distinct counts across many dimensions. The code in its entirety can be found here, but I will build it up step-by-step, referencing the previous step with the shorthand [RESULTS from PREVIOUS QUERY] to minimize repeated text.
First, we select the element of which we want to get a distinct count and its associated dimensions. For example, to calculate the distinct number of products sold by Instacart in a given time period:
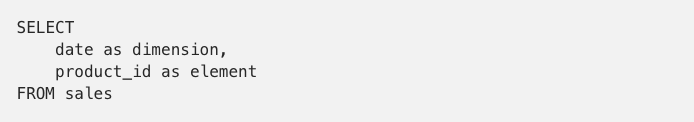
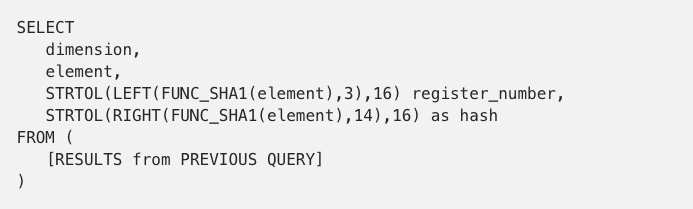
Next, we have to hash the product_id column. Redshift provides several hash functions. In this example, I will use the SHA-1 implementation defined by the FUNC_SHA1 function. The resulting hexadecimal number provides significantly more precision than we need (and are able to store in numeric Redshift data types), so I will use only the 14 rightmost characters as the hash and the three leftmost characters as the register number:
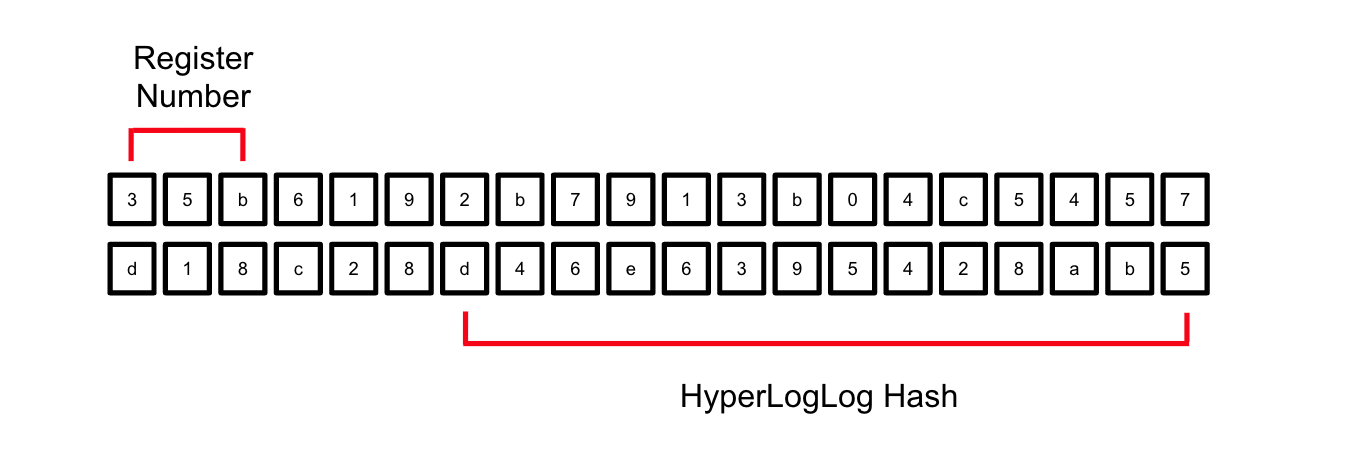
Portions of the hash used in the HyperLogLog calculation
Since the elements are hashed, they are pseudo-randomly assigned to the register represented by the first three characters. The same value will always be added to the same register. Both the register and the hash are converted from hexadecimal to base 10 using the STRTOL function:
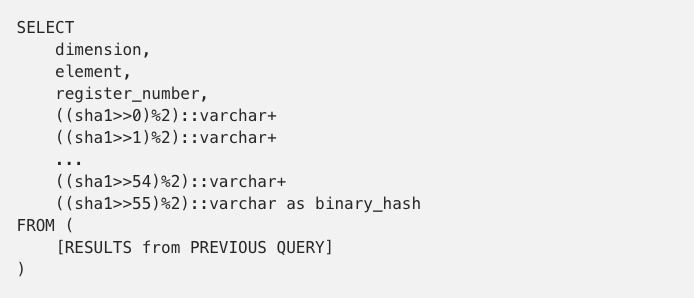
Next, the hash has to be converted into binary, but Redshift does not have a standard function to accomplish this. In the absence of writing a UDF, this operation can be accomplished by bit-shifting (a UDF would be much preferable for readability and efficiency but requires appropriate permissions):
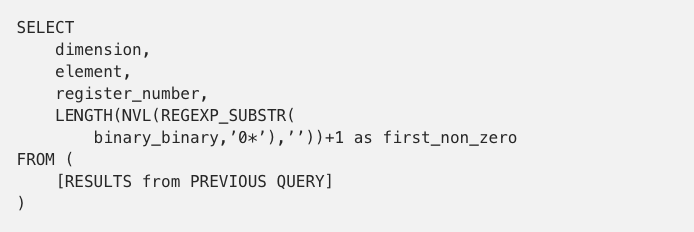
To determine the first non-zero bit of the element, a regex substring expression can be used:
Finally, we have to group by the dimension and register to find the longest run for a given grouping:
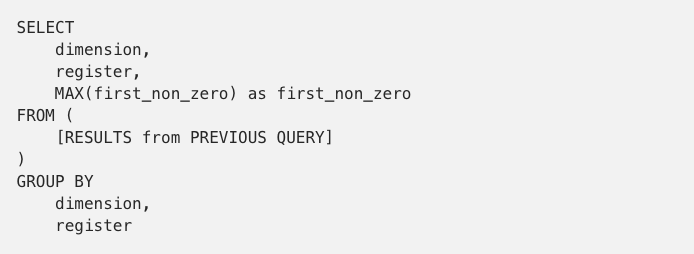
The final query produces our necessary registers, which can now be combined in Tableau in order to calculate distinct counts.
Implementing HyperLogLog in Tableau
To build our visualizations, we take the query we wrote above and create a data source from it in Tableau. In Tableau, we will have to perform two calculations in order to calculate a distinct count of elements. First, we have to find the maximum number of non_zero elements per register in a given grouping. This can be accomplished with the level of detail calculation shown below:
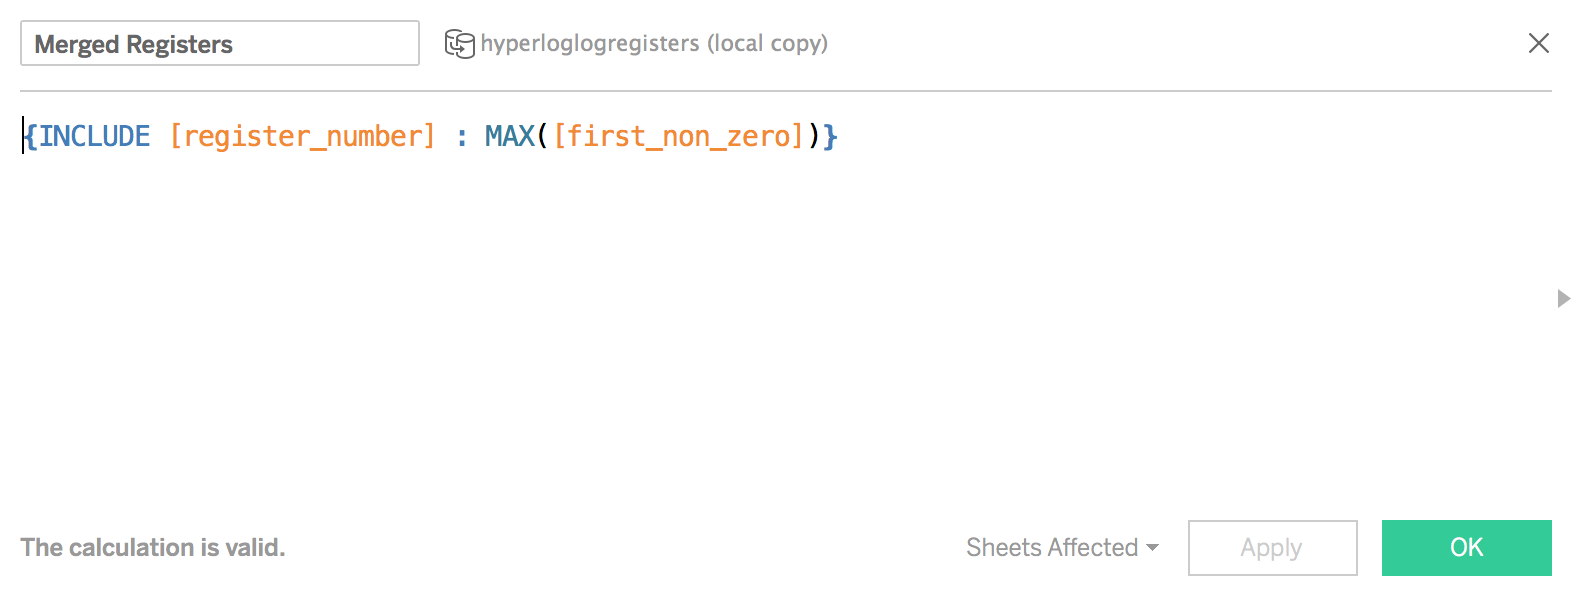
Tableau level of detail calculation to merge registers across aggregated dimensions
Given this calculated measure, we can now apply the formula to determine the cardinality estimate:
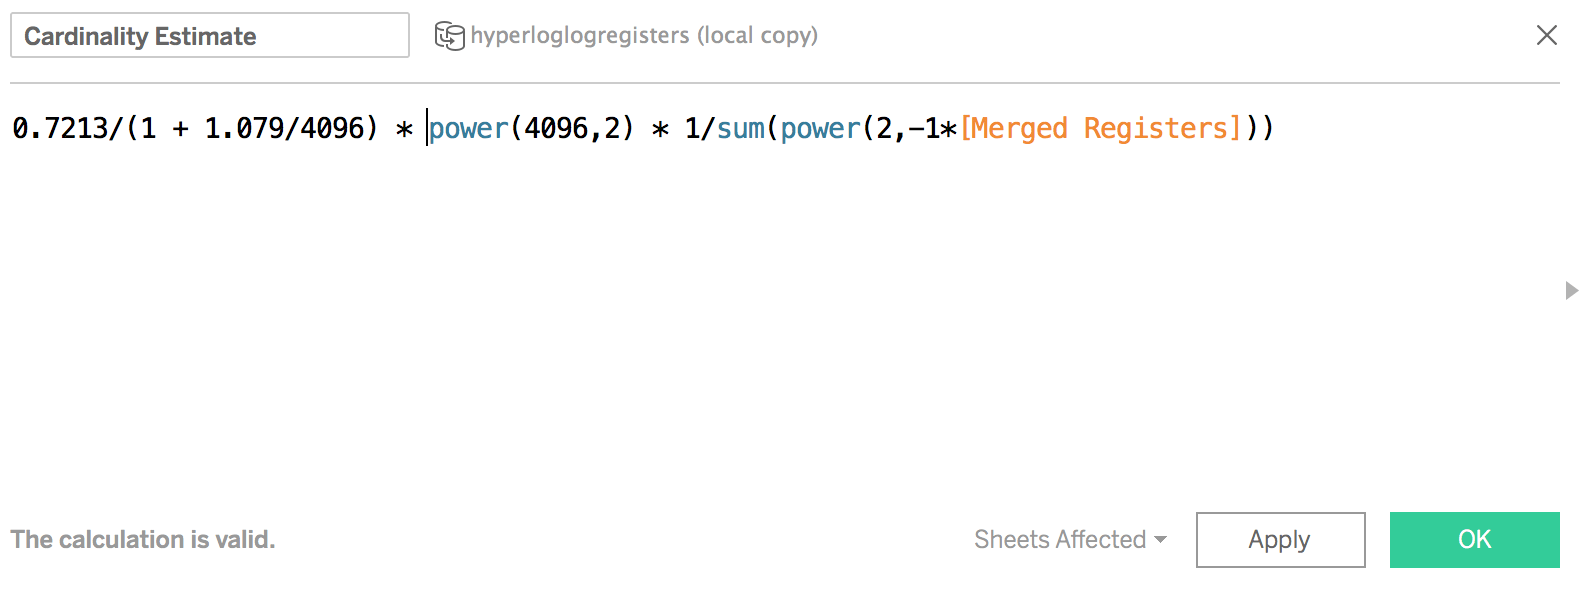
Tableau calculation for the cardinality estimate
Let’s see how the HyperLogLog estimate compares to the equivalent distinct count operation:
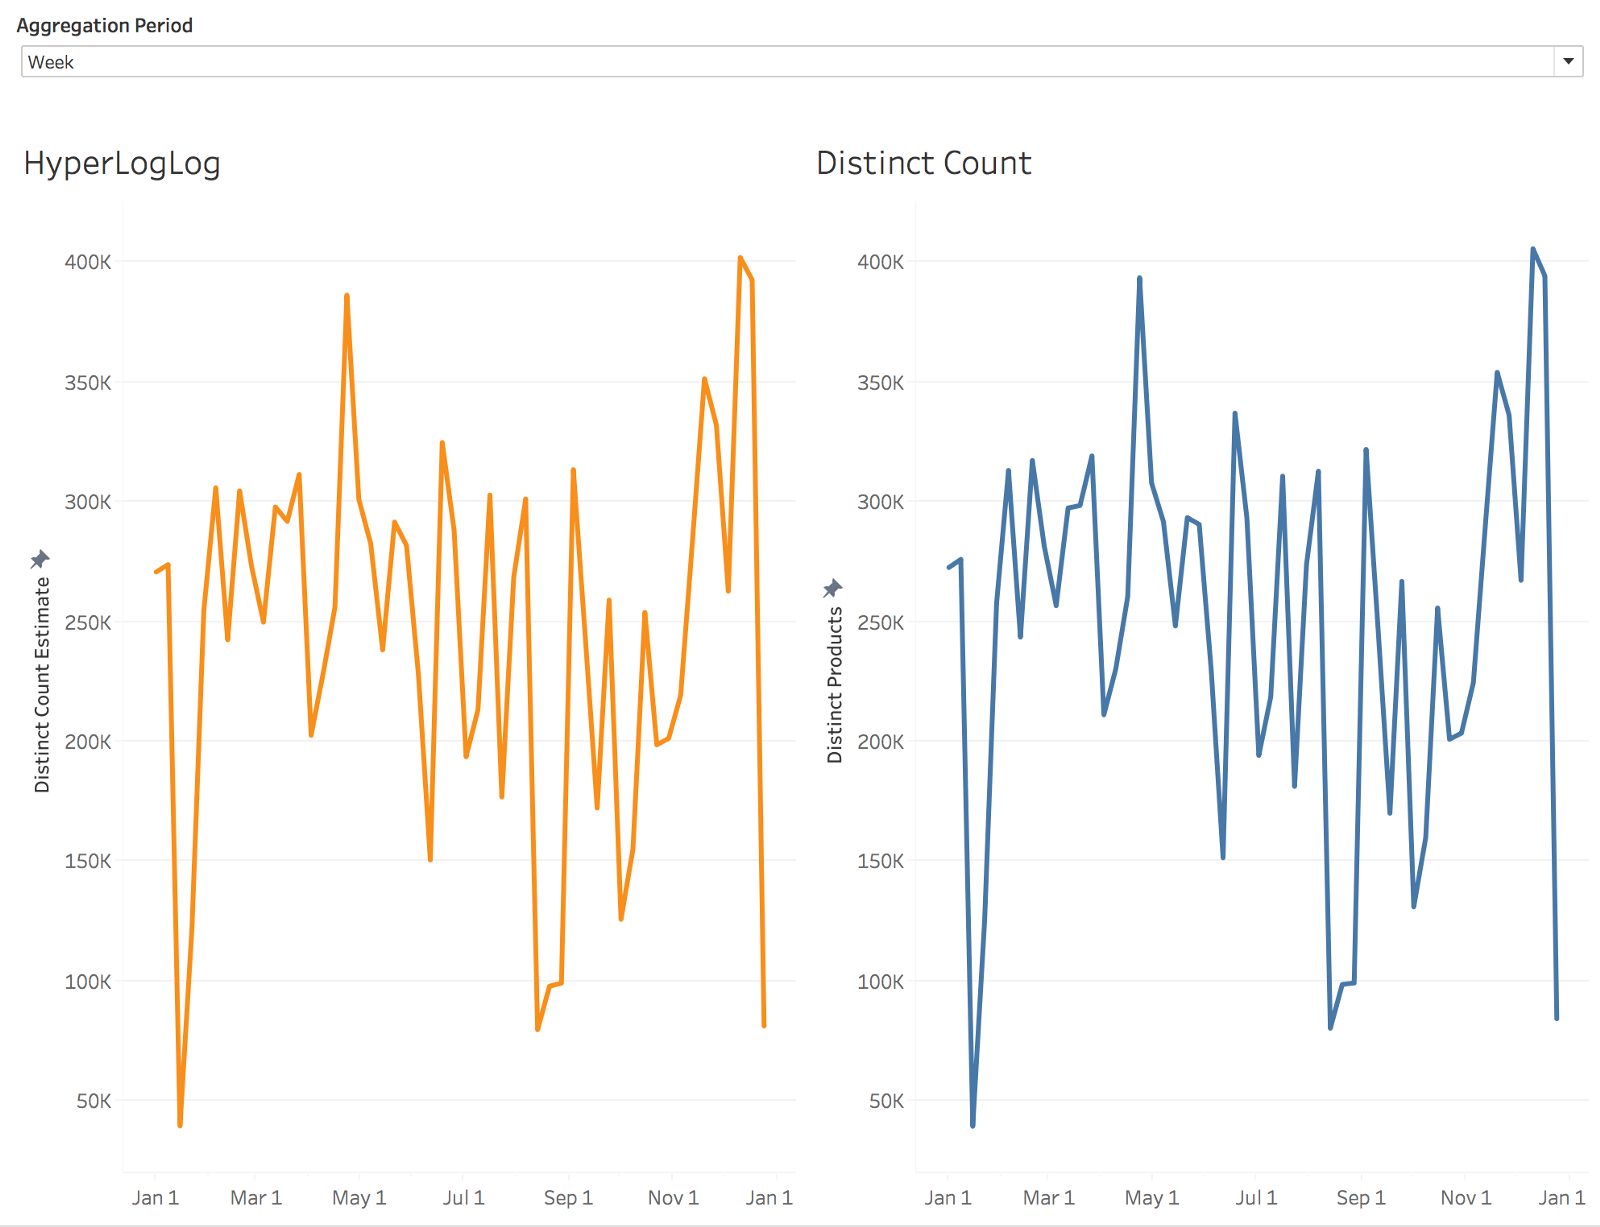
Comparison of HyperLogLog estimate to a true distinct count
While there are some minor differences, we can see that the true count is reflected extremely well and the HyperLogLog version performs significantly better.
Measuring the Performance Improvement
So just how much did HyperLogLog help in this example? Newer versions of Tableau allow you to measure exactly how much time is needed for each operation in rendering a dashboard. Using this feature, we can see in this particular example that the HyperLogLog algorithm performed ~50 times faster in determining a distinct count.
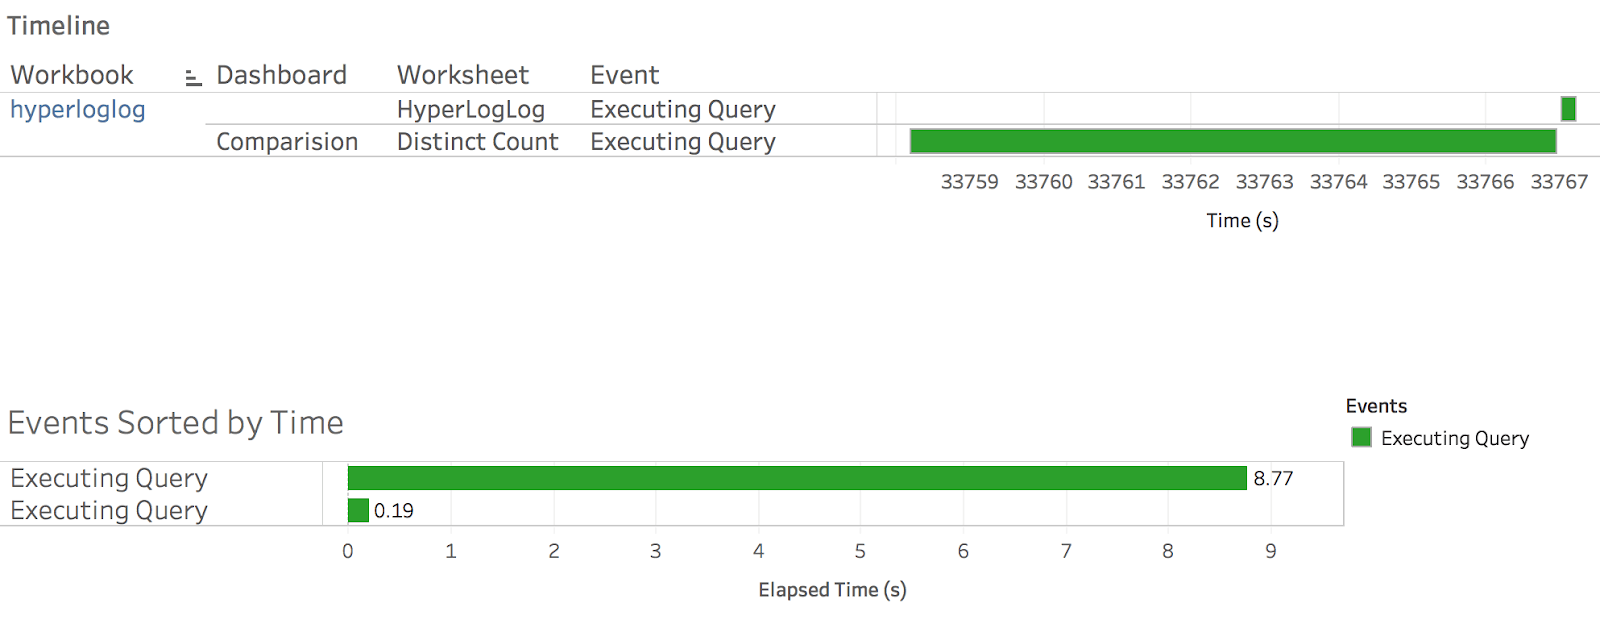
Performance comparison between a HyperLogLog distinct count and the equivalent operation from an un-aggregated data source.
More importantly, the computation cost of the HyperLogLog algorithm now scales with the number of dimensions of the dataset instead of scaling linearly with data volume. Consequently, it will not break down as we continue to surface more and more data on our Tableau server.
Conclusion
In many cases, Tableau is used for quick analysis and to identify trends. In these cases, the 1.6% error from implementing large data sets as aggregates is perfectly acceptable, and utilizing the HyperLogLog algorithms can significantly improve performance compared to distinct counts on unaggregated data sets. Ultimately, this technique provides the team another tool to quickly access our metrics, determine important trends and become even more data-driven.
For more on Tableau and Redshift, read the whitepaper Optimizing your Amazon Redshift and Tableau Software Deployment for Better Performance.
Historias relacionadas

How Team USA uses data to build a digital HQ
 8 Febrero, 2022

Tendencias de datos influyentes en 2022
 3 Febrero, 2022

Healthcare Analytics Hub Starter Kit: Get the data you need faster
 18 Octubre, 2019
The purpose of the Healthcare Analytics Hub Starter Kit is to provide a sample of what your healthcare app could look like. It’s not a complete solution; instead, it’s focused on what’s possible. Please contact your Tableau Account Manager to get started today!
Suscribirse a nuestro blog
Obtén las últimas actualizaciones de Tableau en tu bandeja de entrada.