Tableau 10.2
Sophisticated geospatial and statistical analysis
Answer deeper questions with shapefile support, Python integration, and new statistical functions.
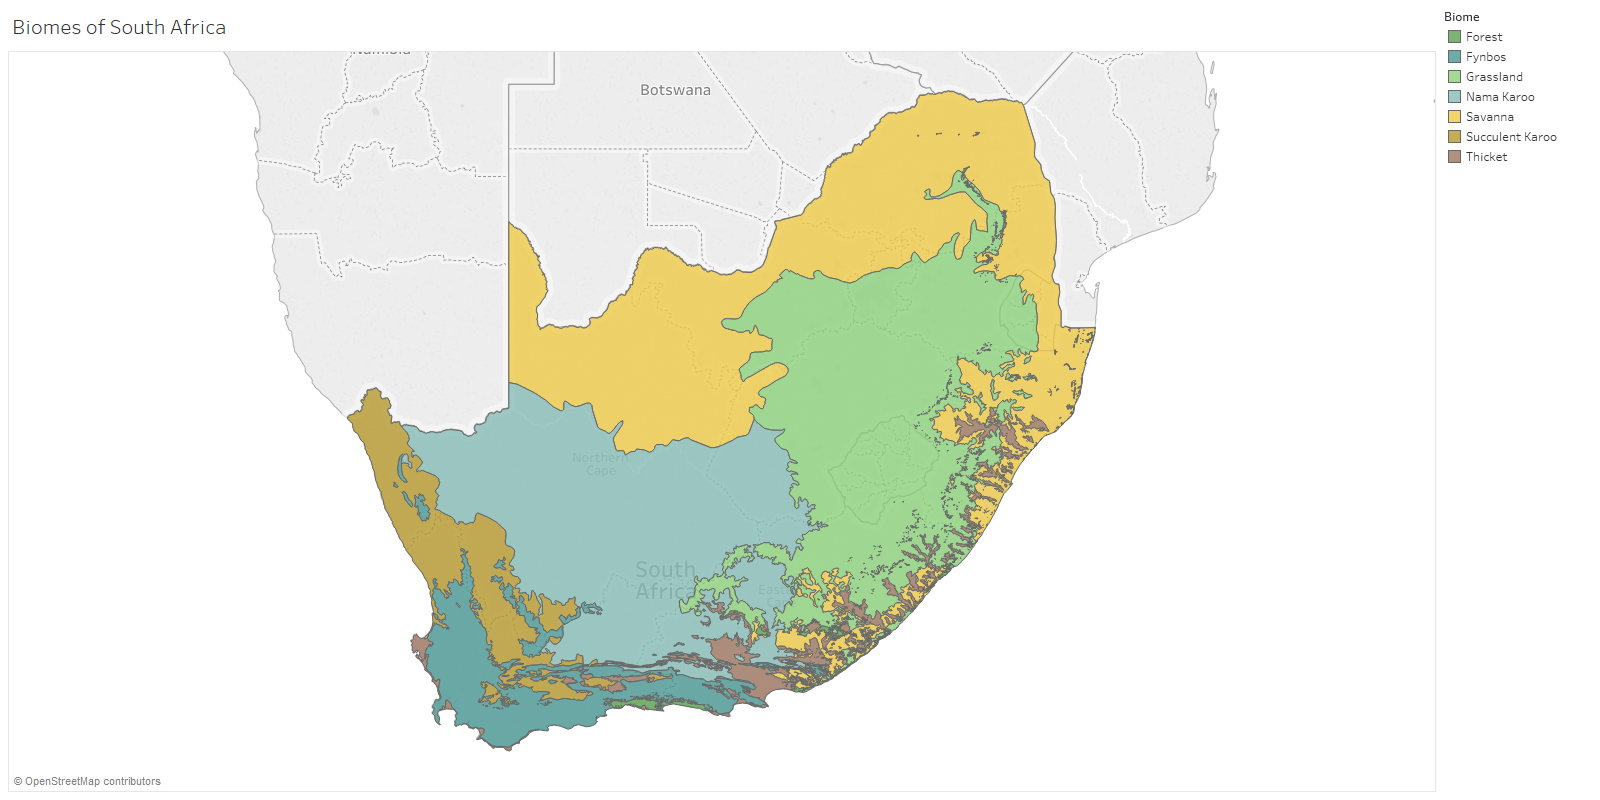
Spatial file connector
Leverage your spatial files directly in Tableau for custom geospatial analysis. With spatial file support, it’s easy to incorporate custom geospatial data like census boundaries or natural resources into your viz. Connect to Esri Shapefiles, KML, GeoJSON, and MapInfo file types.
Maps data additions
We’ve added second-level administrative data (county equivalents) for Austria, Benin, Burkina Faso, Colombia, Ethiopia, Gambia, Ghana, Guinea, Guinea-Bissau, Indonesia, Ivory Coast, Kenya, Liberia, Malaysia, Mali, Myanmar, Nigeria, Norway, Philippines, Senegal, Sierra Leone, Switzerland, Tanzania, Uganda, Togo, and Zambia. Plus, enjoy updated Australia LGAs, New Zealand postal codes, Saudi Arabian cities, US counties, and Indian districts and postal codes.
New geocoding roles
You can now geocode regions in Europe by NUTS code and common name.
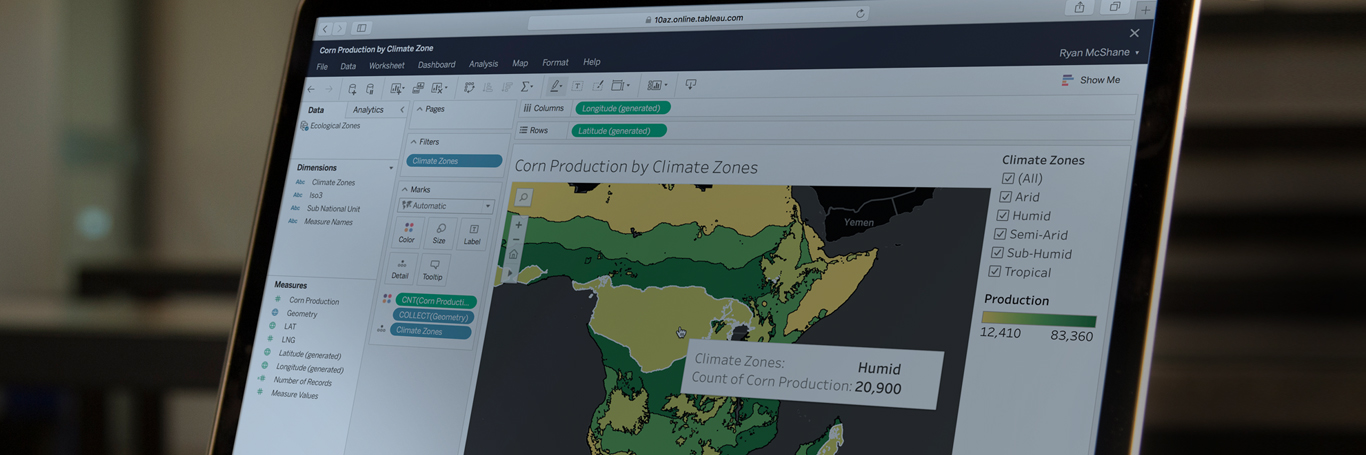
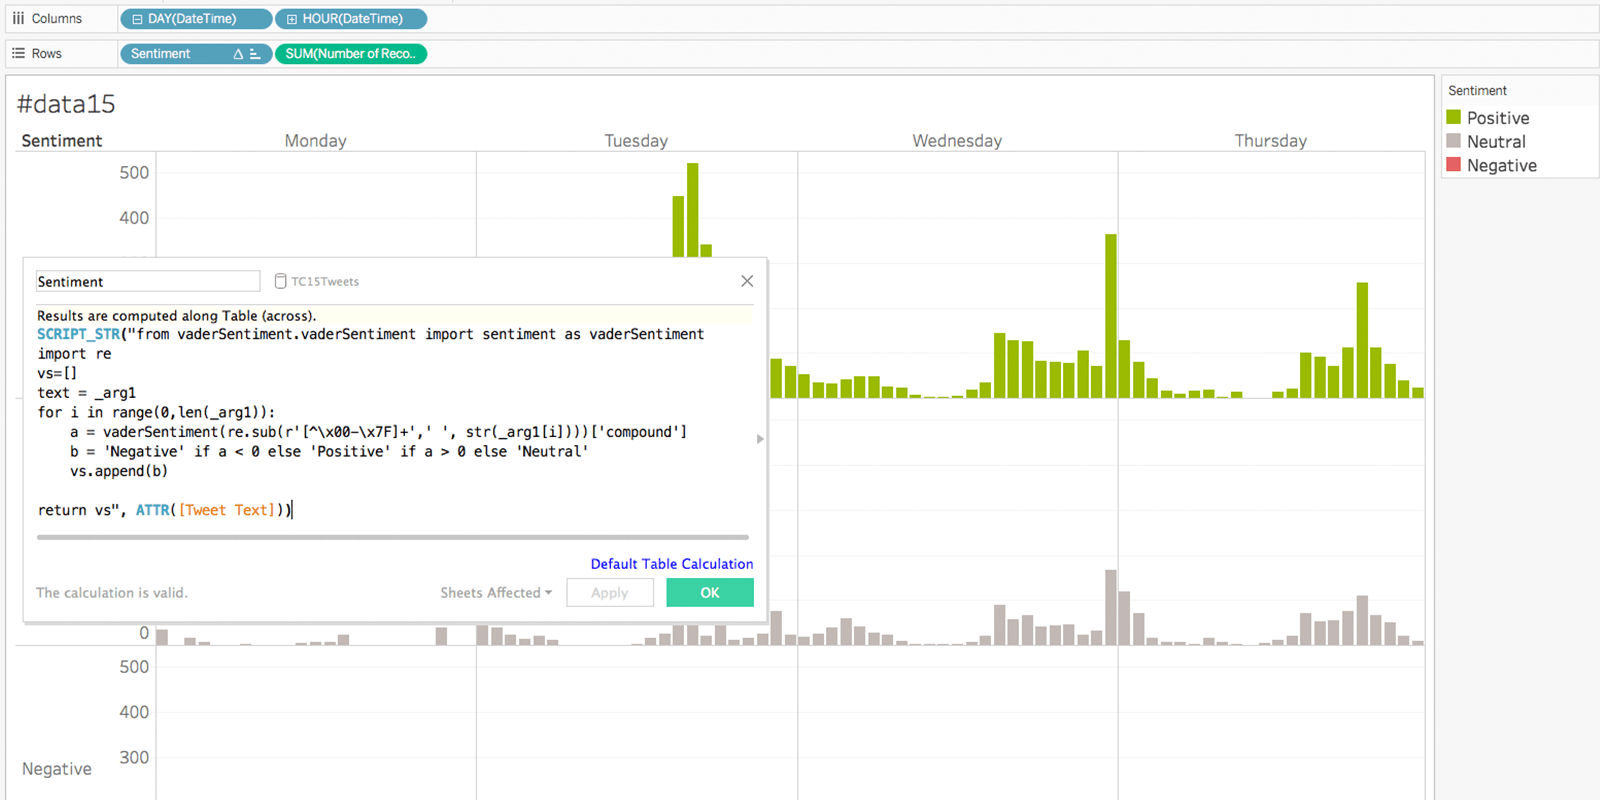
Python
Run predictive models in Tableau with Python integration. Predict customer churn or run sentiment analysis, and control the model with different parameters from a dashboard. See how easy it is to extend the power of your python models
Covariance and correlation
Understand the relationship between measures in your viz with covariance and correlation, new functions in the Tableau calculation language.
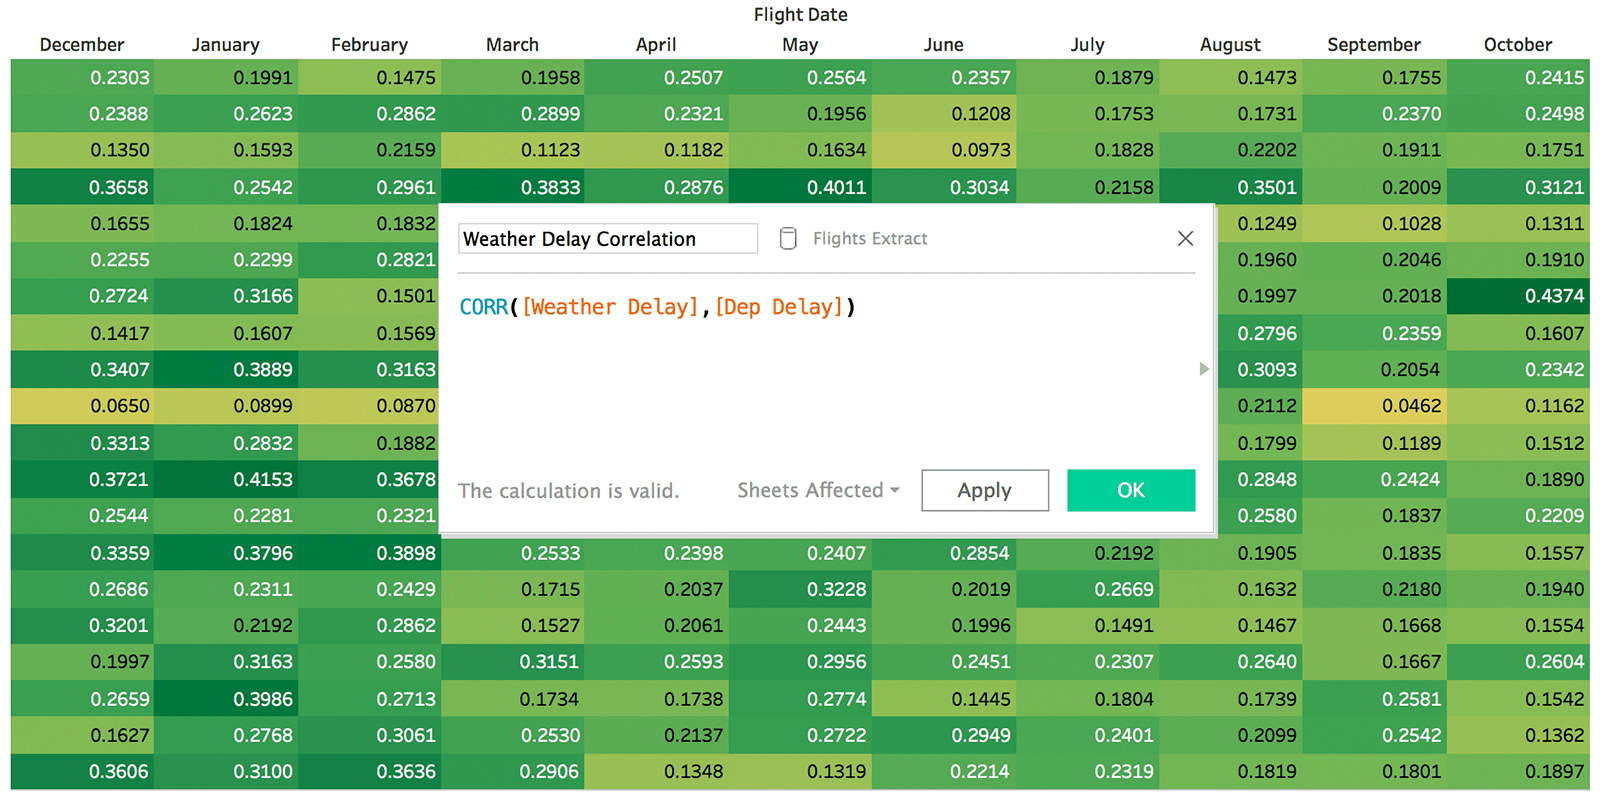
Table calc assistance
Quickly understand how table calcs are being used with your data thanks to running order labels.

Simplified data access for everyone
Connecting to and preparing data for analysis is more streamlined with powerful data prep features and new connectors.
- Union improvements
- Automatic DateParse
- Join calculations
- New connectors
- Connector improvements
- Export data to CSV
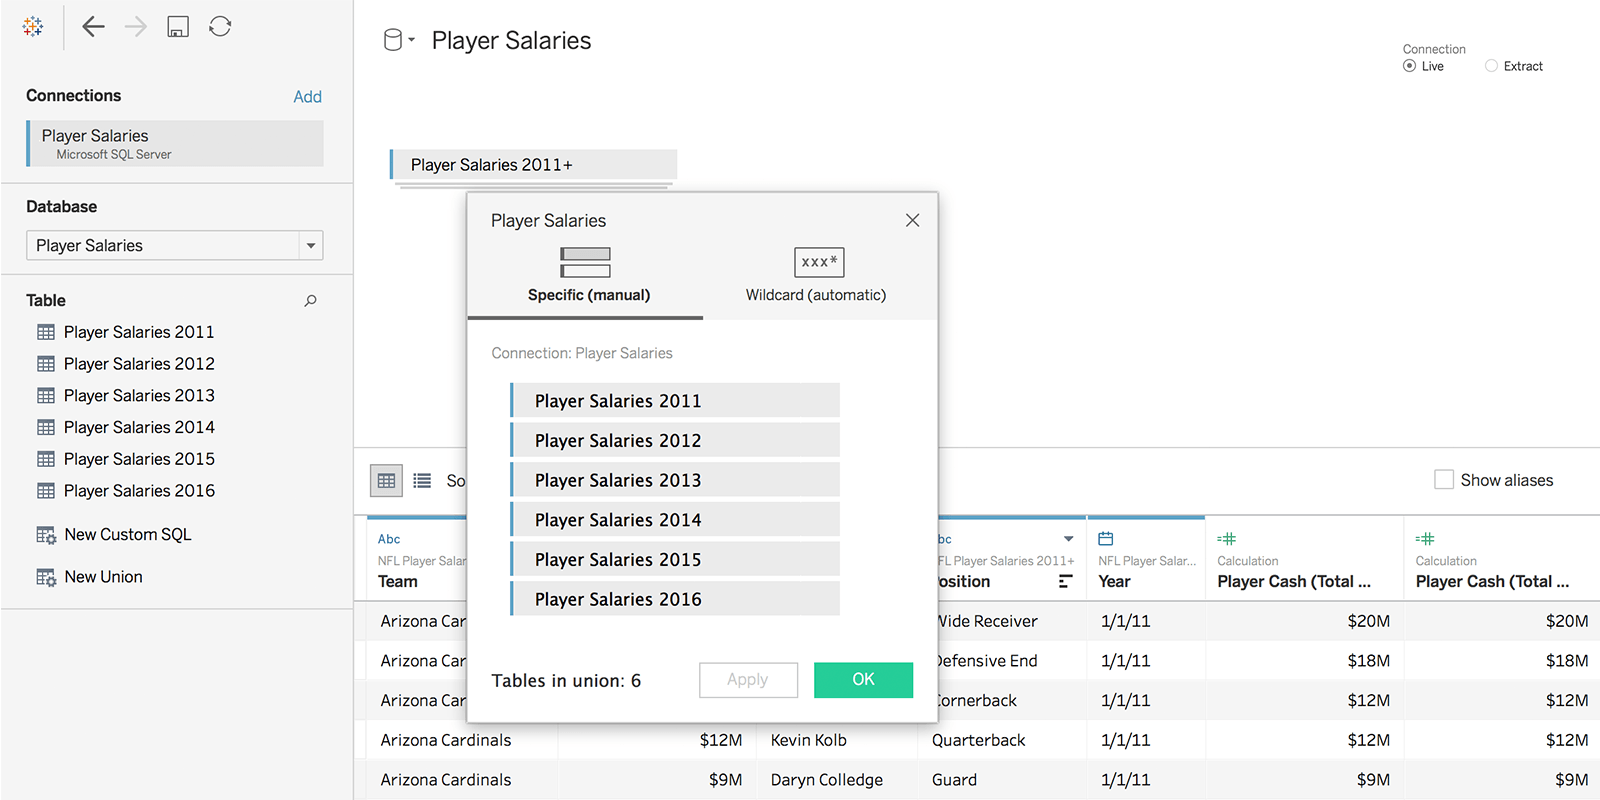
Union updates
Get to your analysis faster with the ability to union tables from a SQL Server, MySQL, Oracle, Postgres, Redshift, or HP Vertica database—right in Tableau Desktop. You can also union local JSON files.
Automatic DateParse
Transform your data from a string to a date type, no calculations required. Simply choose the date type and Tableau will parse your data into the right format.

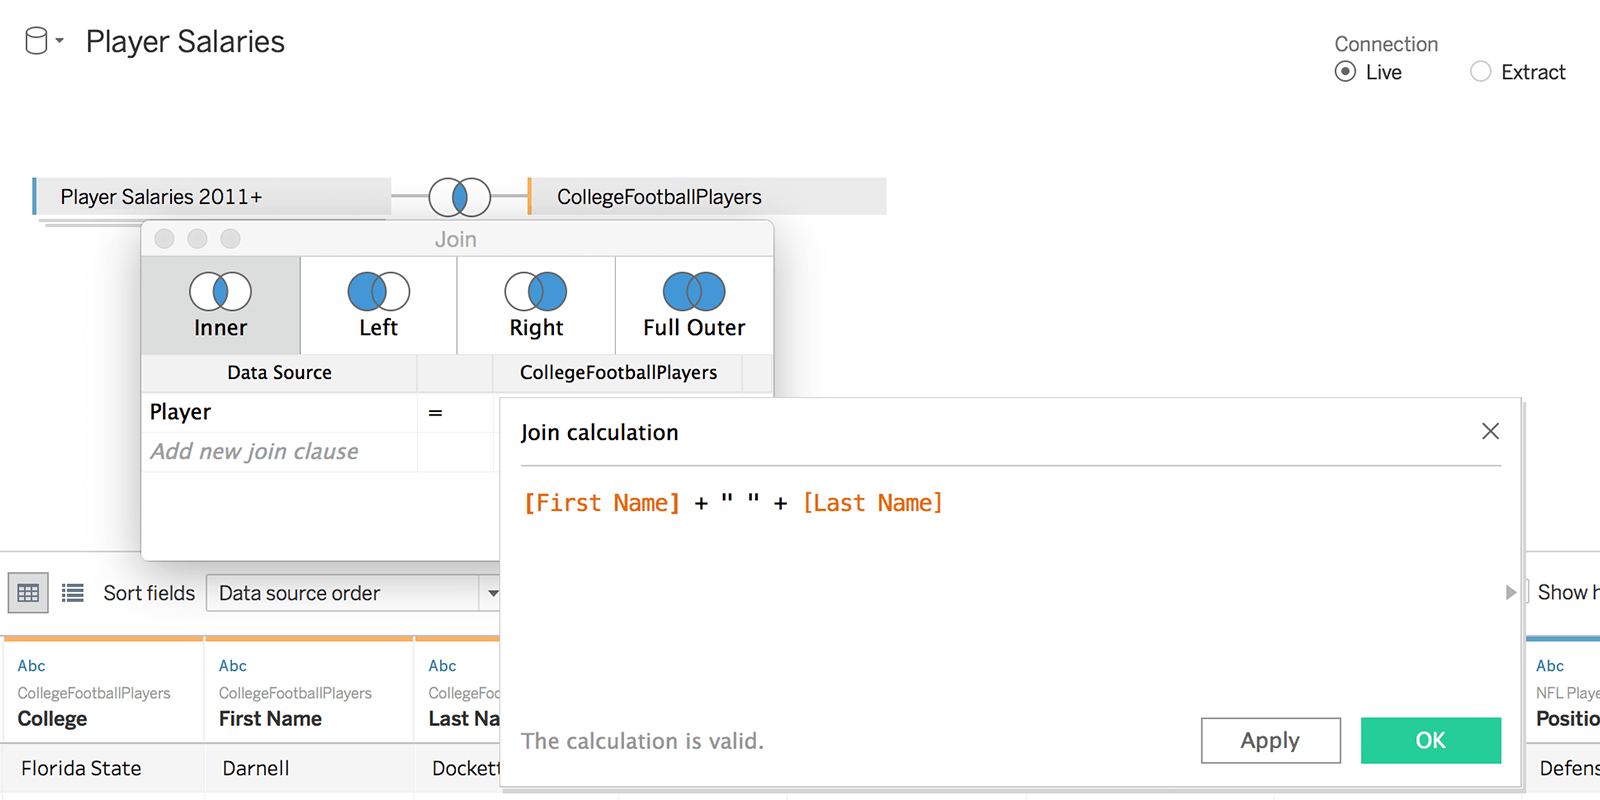
Join calculations
Create custom joins through calculations. Now you can bring multiple data sources together, even if the field formats don’t match.
Apache Drill
Connect to your speedy Apache Drill data with our new connector.
Aster for Mac
Connect directly to your Aster database on a Mac.
SharePoint Lists
See your SharePoint Lists data directly in Tableau with our new connector.
Salesforce cross-database join support
Join your Salesforce data with other data sources, including web data connectors, directly in Tableau.
Tableau Cloud Sync Client improvements
Automate your Web Data Connector experience with the Tableau Cloud Sync Client. Now you can save your WDC username and password, and set a extract refresh schedule. The Sync Client will automatically keep your WDC data fresh.
Presto
You can now use the Presto connector with on-premises or EMR Presto instances.
SSO support for SAP BW
Enjoy a streamlined login experience with SSO support for SAP BW.
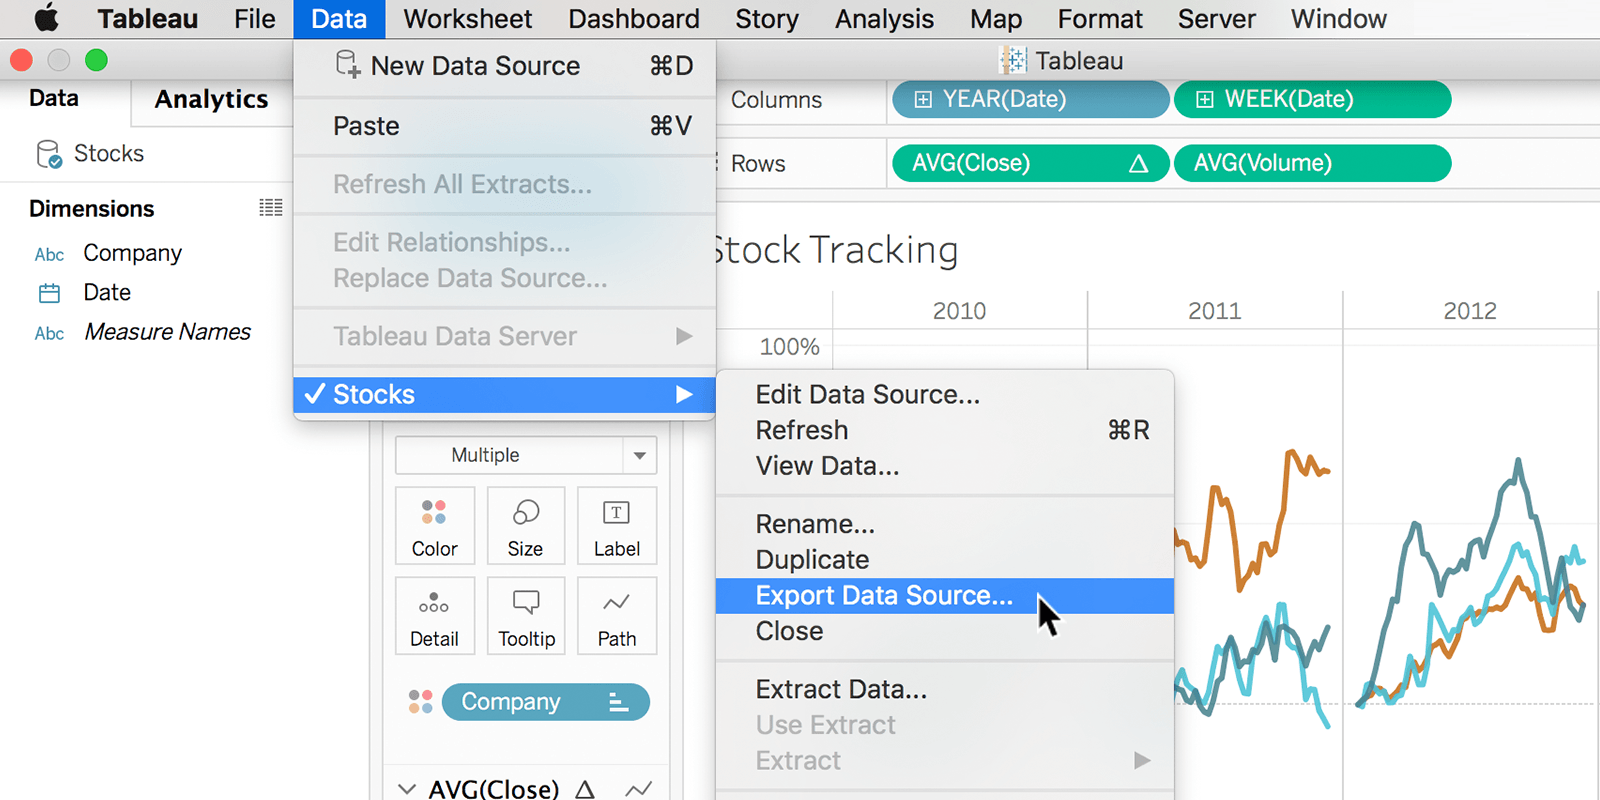
Export data to CSV
Share or reuse the data you’ve transformed in Tableau by exporting it to a CSV.
Improved flexibility for the enterprise
Deploy Tableau at scale with new security, governance, and extensibility features.
Web authoring improvements
Web authoring keeps getting better. Enjoy a new top level menu with added analytical functionality, update colors and borders on your data, edit reference line distributions, and configure more dashboard options all from your browser.

WCAG 2.0 AA conformant vizzes
You can now publish and interact with vizzes that are WCAG 2.0 AA and Section 508 conformant. Common viz elements have keyboard support and function with web-based assistive technologies.
Autosave
Start where you left off, even if your computer crashes, with autosave for Tableau Desktop.
Mac installer
Deploy Tableau programmatically via scripting on macOS. The new installer also includes common database drivers, no separate download needed.
File version number
Instantly know the file version of any workbook. Plus, when you open an older workbook in Tableau, we’ll let you know which version was used to create it.
Tableau Desktop product version update
Upgrade to the latest version of Tableau Desktop, or just check to see which version you’re running, right from the help menu.
OpenID Connect improvements
Use Tableau Server’s enhanced OpenID Connect support to authenticate users. You can now leverage custom claim mapping with Tableau user names, ignore the JWK for IdP validation, and support static or file for IdP discovery.
Guest access per site for Tableau Server
Enjoy greater control over site access. Site and Server Admins can now determine if sites should have guest access or not.
Tableau Mobile web authentication
Tableau Mobile now includes robust web authentication, making it easier to have a seamless sign-in experience, even if a reverse proxy is used.
MDM configuration parameter improvements
Admins deploying Tableau Mobile through a MDM now have more configuration options for better control of the login and sharing experience.
REST API improvements
With better fields support you can now specify the fields you want to receive from a GET request. We’ve also added CORS and JSON support for JavaScript and web developers. And you can now download high-resolution images for your views on Tableau Server.
Extract API improvements
Our Extract API now supports spatial data types using WKT format. This enables the use of custom shapes in any Tableau Data Extract files you generate.
Document API improvements
You can now read/write captions, set ports, and leverage initial SQL and query banding. We’ve also released rich, developer documentation on GitHub.
Tableau Server Client
The Server Client now supports schedules, groups and does a better job of handling large downloads.
Custom portal code sample
Jumpstart your custom portal development with our code sample. Use our example to embed Tableau content in your own web pages and quickly build external controls for embedded dashboards.
Site to site migration code sample
Programmatically migrate content between sites and even repoint workbook data connections. Also shows how to use our server client library with our Document API code sample.
Web Data Connector 2.2
You can now optimize multi-table joins by passing down filtered information from one table to the next to return a smaller set of data.
New mobile toolbar
Enjoy a brand new mobile toolbar for iOS, with a sleek sharing experience and more room for your viz.

Tell the stories in your data
New legend options and formatting controls give you more ways to communicate data discoveries.
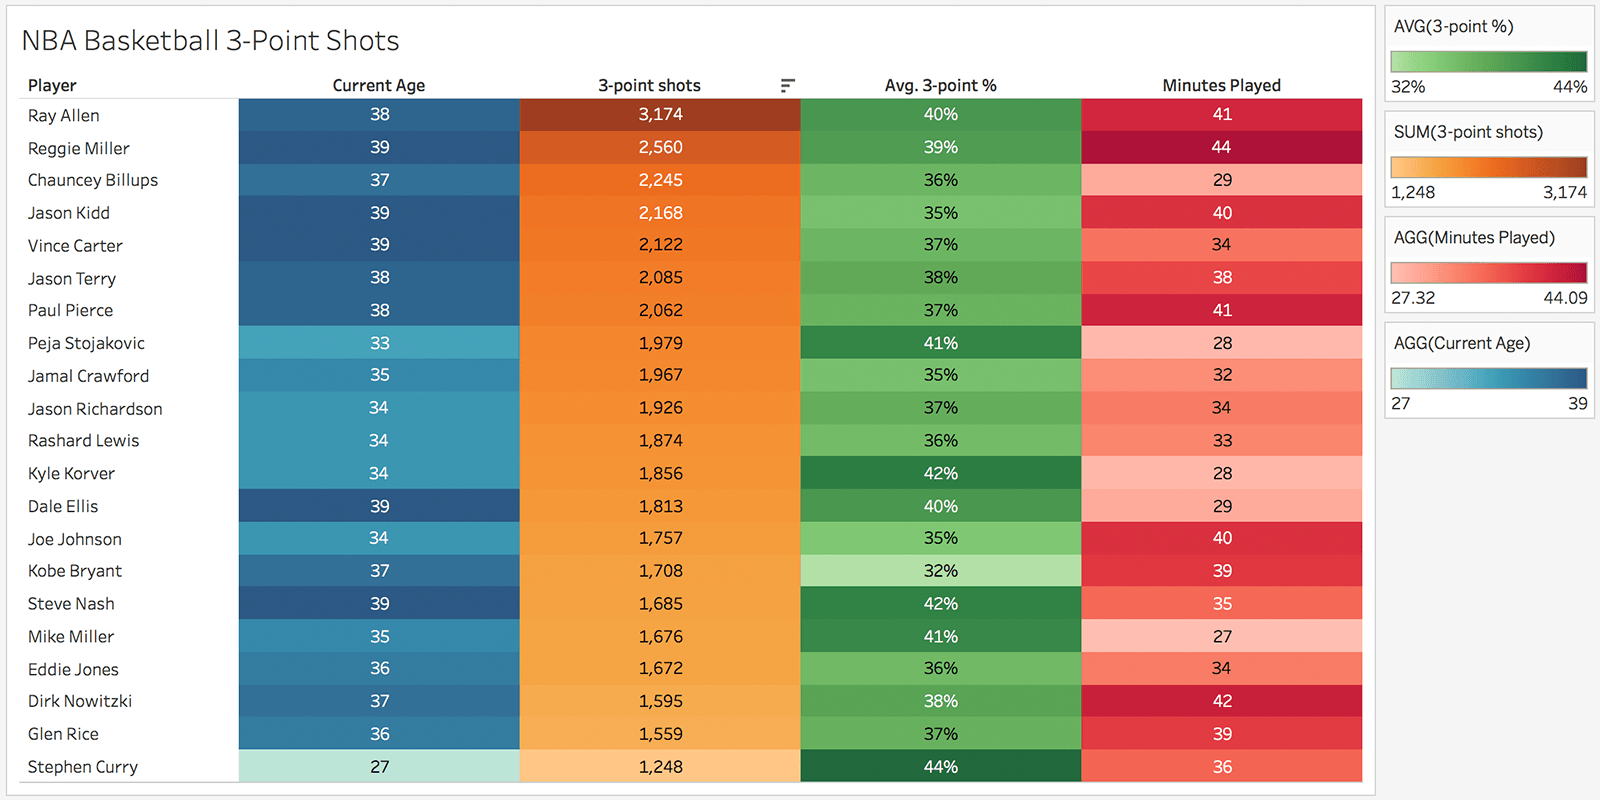
Legends per measure
Create a unique legend per individual measure so you easily spot trends when displaying multiple measures in a viz.
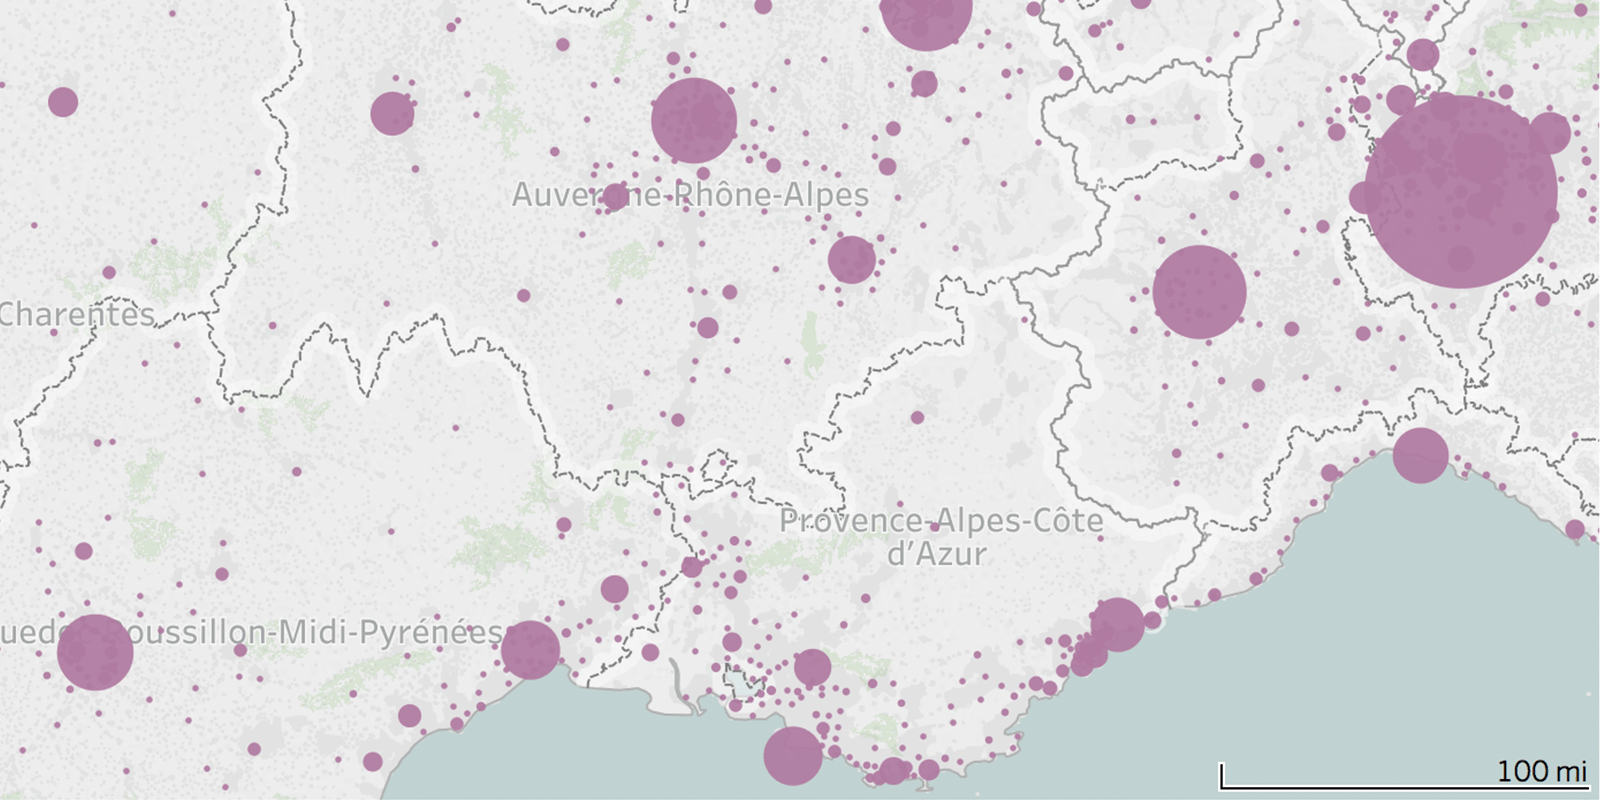
Map scale
Instantly understand your geographic data in context with our dynamic map scale.
Workbook formatting for lines
Save time by formatting lines across an entire workbook with just a few clicks in Tableau Desktop.

Story Points improvements
Now you have more options for telling your data story. Use an optimized layout menu to apply formatting, and choose from caption boxes or a simple numbered navigator to put your data on stage.

Marks Card
See all your pills at a glance. Now you can see all your pills on the marks card without scrolling.
