Top 15 LOD Expressions
Tableau's features are carefully designed to help people transform data into meaning. The easier it is to express ideas in a calculation language, the more meaning people can generate. Level of Detail (LOD) Expressions allows people to express powerful concepts using simple statements.


Tableau’s mission is to help people see and understand data. Our features are carefully designed to help people transform data into meaning. One area of focus is calculations. The easier it is to express ideas in a calculation language, the more meaning people can generate. The introduction of Level of Detail (LOD) Expressions in Tableau 9.0 was a breakthrough in this regard. These LOD expressions let people express powerful concepts using simple statements.
What Are LOD Expressions?
LOD Expressions provide a way to easily compute aggregations that are not at the level of detail of the visualization. You can then integrate those values within visualizations in arbitrary ways. That may sound abstruse, so this post will illustrate the concept through a series of common questions. Near the end, we will dive into some more advanced analytic examples. The whitepaper on Level of Detail Expressions provides a more general overview. For details on syntax and usage, see Level of Detail Expressions in the Tableau Desktop online help section.
Each of the following 15 workbooks contains customized data sources and can be downloaded for further details. If you do not have a copy of Tableau Desktop, you can get a free 14-day trial here. We recommend that you use these customized data sources if you choose to follow the instructions and re-create the views.
1. Customer order frequency
Finding the number of orders each customer has made is relatively easy, but what if we wanted to know the number of customers who made one order, two orders, three orders, and so forth? To build this view, we must break up the number of customers by the number of orders made. This is a simple question, but breaking out a measure by another measure would be difficult without LOD Expressions.
Consider the sales database of a superstore that has multiple items per order. The distinct count of orders by customer gives the number of orders each customer made. A simple LOD expression can turn the number of orders into a dimension that breaks out the number of customers.

2. Cohort analysis
Do longer tenured customers make a larger contribution to sales? The view below groups customers by the year of their first purchase to compare sales contributions annually across cohorts. The minimum order date per customer will give the first purchase date. However, since the data in the view is not displayed by customer, we must use an LOD Expression to fix the minimum order date per customer.

3. Daily profit KPI
We can certainly view profit trends over time, but what if we measure our success by the total profit per business day? We would probably want to know the number of profitable days achieved each month or year, especially if we were curious about seasonal effects. The following view shows how LOD Expressions allow us to easily create bins on aggregated data such as profit per day, while the underlying data is recorded at a transactional level.

4. Percent of total
What is each country’s revenue contribution to global sales? If we color by the contribution percentage, we immediately see that the US has the highest contribution to the global sales revenue. However, we may want to focus on a market like the EU that, in absolute terms, has a small contribution. Without LOD Expressions, filtering on a market would cause the percent of total to recalculate, displaying each country’s contribution to its market. With a simple LOD Expression, we can filter on a market, and still measure the global contribution.

5. New customer acquisition
What is the daily trend of total customer acquisition by market? Finding the trend in this data will help us understand how well the regional marketing and sales organizations are doing at generating new business. The steeper the line, the better the acquisition trend. As a line flattens out, some action must be taken to increase lead flow.
An LOD Expression ensures that repeat customers are not miscounted as new customers, as data must be evaluated at the customer level even though it is displayed visually by market and day.

6. Comparative sales analysis
It’s relatively straightforward to find the difference from average, but what if you wanted to find the difference from a selected category? First, you must isolate the sales of the selected category. Then an EXCLUDE Expression is needed to repeat that value across all other categories. It is then easy to take the difference of each category’s sales from the rest.

7. Average of top deals by sales rep
What is the largest deal that each sales rep has closed? And then considering these top deals by sales rep, what is the average by country? LOD Expressions allow us to look down to the sales rep level of detail even though the data is displayed visually at the country level. In the view below, the average top deal size by sales rep is higher in countries colored blue and lower in countries colored orange. We can use this information to guide drill-down analysis from country to sales rep.

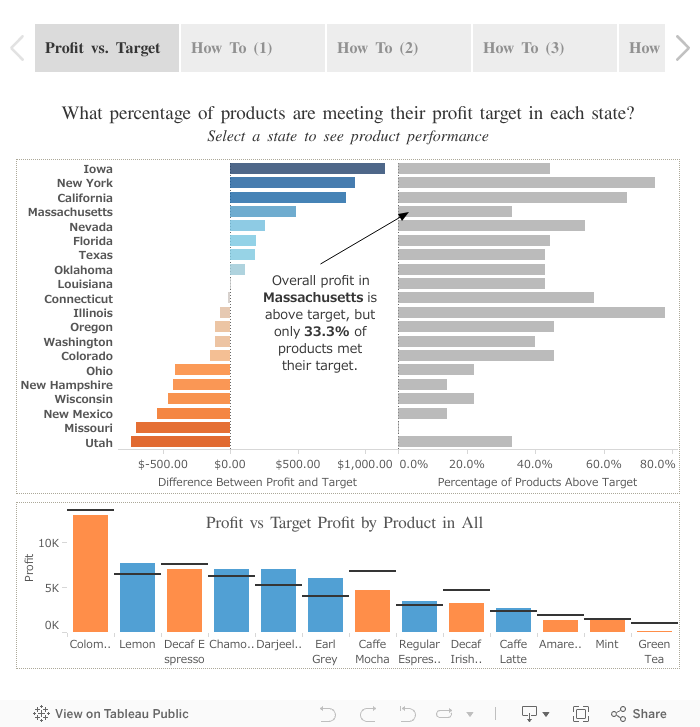
8. Actual vs. target
In this visualization, we are displaying the difference in actual profit compared to target profit per state for a chain of coffee houses. In the top view, we can clearly see which states have exceeded the target and which states missed the target. However, when aggregating up this way, we can miss important nuances. Some states are above target because every product sold in that state is above target. Others are above target because a single product exceeded its target by enough to make up for all of the other products that missed their target. We can use an LOD Expression to identify the percentage of products sold within a state that are above target.
9. Value on the last day of a period
Data that represent the status on a particular day such as inventory numbers, headcount of employees, or daily close value of a stock need be treated differently than metrics that can be aggregated such as sales or profit. In these cases, you may want to display the value on the last calendar day of a month. Furthermore, we would expect that drilling down from month to week would update to display the value on the last day of the week. In the example below, we have stock data for multiple tickers on a daily level. The view compares the average daily close value to the close value on the last day of the period. Using a simple LOD Expression, we can look down to the daily level, even if the data is displayed visually at a higher level.

The following 6 examples illustrate how level of detail expressions can be applied to more advanced scenarios, as well as use cases that draw on the broader feature set of tableau. For further examples of more basic scenarios, watch the On Demand Training Videos on LOD expressions.
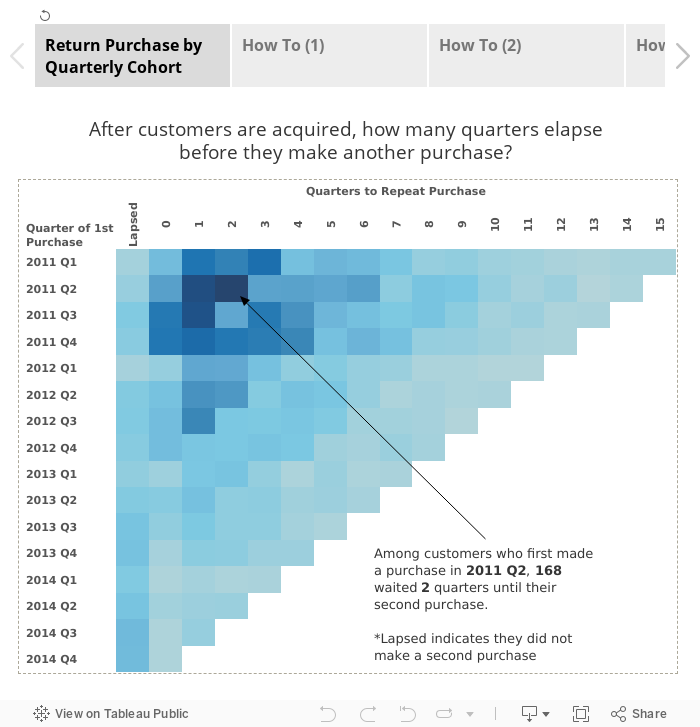
10. Return purchase by cohort
Acquiring new customers can be expensive, so we want to ensure that existing customers are making repeat purchases. How many customers take one, two, three, N quarters to make a repeat purchase? How many have never made a repeat purchase? What does this behavior look like broken out by quarterly cohorts? We can use a FIXED Expression to find the first and second purchase dates per customer, and derive the number of quarters to make a repeat purchase from this.
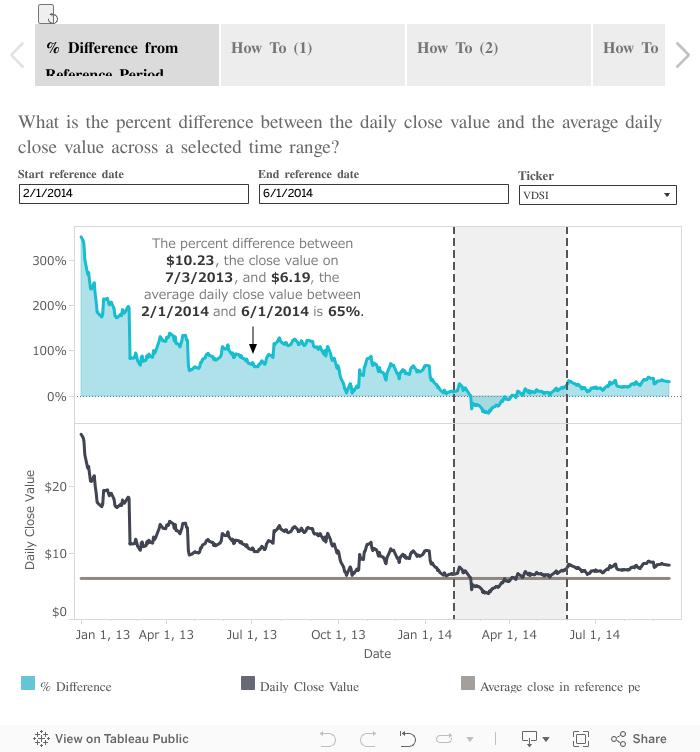
11. Percent difference from average across a range
Example 6 shows how to make a comparison to a single selected item, but what if you wanted to make a comparison across a range of values? For example you may want to compare the daily close value of a stock to the average daily close value before a major event occurred that affected the industry in question.
12. Relative period filtering
A common metric for analyzing performance is year-to-date and month-to-date comparisons relative to the previous year. We can do this easily by filtering relative to today, but what happens if the data is refreshed on a weekly basis? Suppose your last refresh occurred on March 1, but the current day is March 7. A month-to-date comparison would show March 1 through March 7 of the previous year versus March 1 of the current year. This could cause significant alarm, where none is needed! A simple LOD Expression allows us to find the maximum date in the dataset.

13. User login frequency
How many users log in to a website or application once a month, once every two months, once every three months, and so forth? What is the average login rate? How does the distribution skew around this average? The granularity of the data is log in date per user ID. In other words, there is one row for every day that a user logged in. Building this view requires slicing the number of customers by the login rate, meaning that we must slice a measure by a measure. We saw in example 1 how LOD Expressions make this type of analysis easy.

14. Proportional brushing
The most fundamental question in any analysis is: “Compared to what?” Sometimes when filtering, we would like to compare the selection to the total amount, as opposed to simply filtering down to the selection. This technique is known as proportional brushing.

15. Annual purchase frequency by customer cohort
Are more tenured customers more loyal, where tenure is measured by the year of customer acquisition and loyalty is measured by annual purchase frequency?
We know from example 1 how many customers purchase exactly one time, exactly two times, and so forth. However rarely will a marketer want to identify all customers who purchased exactly five times. Instead, it may be more useful to know how many customers purchased at least five times.
Additionally we know from example 2 that most customers are acquired in 2011 and fewest customers are acquired in 2014. Looking at the absolute number of customers will only reveal this same trend again. Therefore, it may be more interesting to see the percent of total customers per cohort as a measure of loyalty.
So to rephrase the initial question more concretely, what percentage of customers in each cohort purchased at least one, two, three, N times in a year?
This example combines a variation of the number of orders LOD Expression from example 1, the cohort expression from example 2, and a variation of the percent of total expression in example 4.

Related Stories

5 Ways to Use Tableau Public to Achieve Your Goals
 January 11, 2025

World Mental Health Day: Elevating Awareness Through Data Visualization
 October 10, 2024

From TV Screens to Tableau: Visualize Your Favorite Shows with IMDb
 August 31, 2024