Introducing TabJolt: A point-and-run load and performance testing solution for Tableau Server


Many of you have asked about scalability testing of Tableau Server. In response, we laid out our testing methodology, practices, and guidance in our whitepaper on scalability.
But many of you also wanted to know about load testing Tableau Server in your own environment, with your own workbooks. In some cases, you wanted to determine concrete, scenario-specific capacity needs. In other cases, you wanted to accelerate the multi-week load testing effort required (by IT policy) for go-live production with a new version of Tableau Server. We wanted to find a better way to empower you to accelerate rollouts and assess your own deployment and capacity needs.
I am excited to announce the release of a Tableau Server load-testing solution that our own engineering teams use internally on a daily basis. We call this tool TabJolt. Just like (the now-discontinued) Jolt Soda, TabJolt can push a heavy workload onto Tableau Server to give it a jolt, so you can study how the server bends or breaks under load.
You can download TabJolt, as is, via GitHub. Here's what you need to know to get started.
Get to know TabJolt
What is Tabjolt?
TabJolt is a “point-and-run” load and performance testing tool specifically designed to work easily with Tableau Server 9.0 or later.
Unlike traditional load-testing tools, TabJolt can automatically drive load against your Tableau Server without script development or maintenance. Because TabJolt is aware of Tableau’s presentation model, it can automatically load visualizations and interpret possible interactions during test execution.
This allows you to just point TabJolt to one or more workbooks on your server and automatically load and execute interactions on the Tableau views. TabJolt also collects key KPI metrics like average response time, throughput, and 95th percentile response time, and captures Windows performance metrics for correlation.
Of course, even with TabJolt, users should have sufficient knowledge of Tableau Server’s architecture. Treating Tableau Server as a black box for load testing is not recommended, and will likely yield results that aren’t in line with your expectations.
With the traditional approach of querying first then visualizing next, pre-canned BI reports go through a long waterfall development process and optimization efforts. Our patented VizQL technology combines query and visualization into a single step to keep the user in the flow of analytics.
Understanding the Tableau way of doing things will help you set up your tests scenarios and execution for success. You can learn more about Tableau Server’s architecture in the Tableau Server administration guide.
When should I use TabJolt?
Here are the key questions TabJolt will help you answer:
1. I want to deploy a brand new Tableau Server. How will Server scale on my hardware and my workload?
2. I am moving from Tableau Server 8.0 to 9.0. Given my workbooks and hardware, how will Tableau Server 9.0 scale in my environment?
3. I want to find the best server deployment configuration. Given my hardware, workbooks, and environments, how can I find the configuration that works best for our deployment?
4. I need to complete a load test as part of go-live testing for Tableau Server, which takes multiple weeks. How do I accelerate the time it takes to run a full go-live load test?
I have often been surprised by the creative ways in which our customers and partners work with Tableau. I would be curious to see what other uses you may find for TabJolt—perhaps a cache warmer?
How does TabJolt work?
TabJolt can be installed on one or more load generator machines and can drive load to one or more nodes in a Tableau cluster. How you deploy the Tableau Server cluster depends on your test configuration and planning needs. The figure below shows one example.
TabJolt uses JMeter under the hood and is capable of not only executing large Tableau workloads on Tableau Server, but also gathering critical system and infrastructure metrics as well as application JMX metrics.
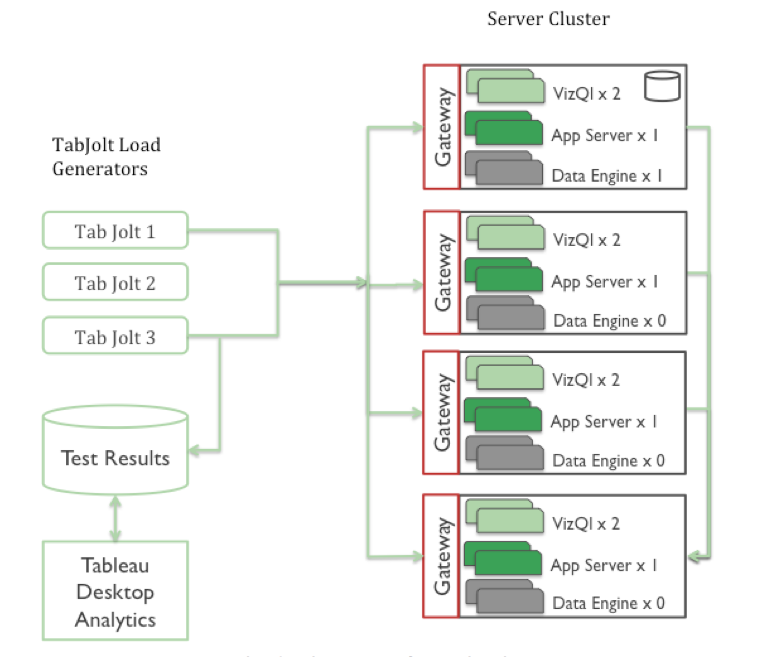
TabJolt can automatically load and interact with Tableau visualizations published on Tableau Server. All you need to do is configure TabJolt and point it to the correct server instance and workload. TabJolt simulates virtual users based on your configuration settings, and measures various metrics. It records those metrics in a Postgres database where you can maintain a history of your tests.
After completing the tests, you can open the Tableau workbook we provide in the download, connect to your instance of Postgres, and analyze the results. The Tableau workbook has some pre-built analytics views to show you key metrics out of the box. TabJolt, however, does not draw conclusions or infer your direct-capacity needs based on test results. As the user, you should be familiar with performance and load testing methodologies, and be able to draw conclusions based on observations from the data.
How to get started
So let's get started. The process is relatively simple:
1. Install prerequisites.
2. Configure TabJolt.
3. Run your first test.
In this version, we don’t have a packaged installer for all the third-party dependencies, so make sure you have them downloaded and installed separately.
Prerequisites
To install TabJolt, you’ll need a Windows machine with a minimum of two cores with at least 8GB of RAM as your load generator. As a best practice, you should monitor this machine for CPU and memory to ensure that your test runs don’t bottleneck the load injector. In addition, you’ll need the latest versions of Java,
Tableau Desktop 9.0, and Postgres.
For a realistic load test, you should NOT use the Tableau Server Postgres instance for recording and storing your TabJolt test results. You don’t want the act of measuring your system to impact your system under test. So it’s important to keep your Tableau Server, the system under testing, separate from Postgres for TabJolt.
You can find Postgres configuration steps and troubleshooting tips in the installation guide you downloaded with TabJolt.
Your first TabJolt test run
Now you can start your scale test by using a Windows command prompt, navigating to c:\tabjolt, and running the example command below. This example tells TabJolt to run the test for 60 seconds (using “--d”) and run a single user client (“--c"). Of course, you can change these parameters as you wish.
Command: go --t=testplans\InteractVizLoadTest.jmx --d=60 --c=1
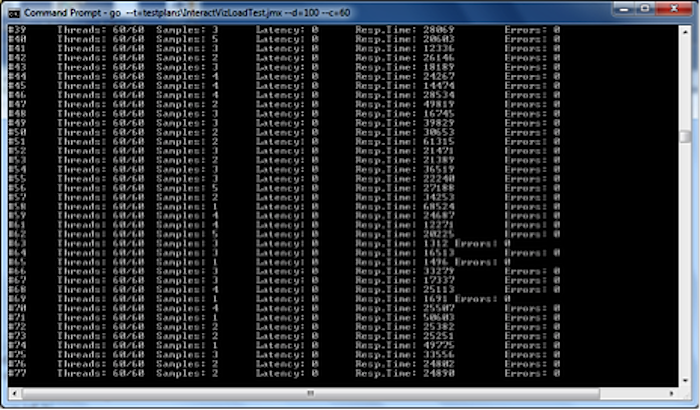
IMPORTANT: At the end of the run, on the command line, you will get the run id, which you need to use as a filter when analyzing your data in Tableau Desktop.
Explore all the options with go /? and experiment with the options. If you expect to execute many runs, consider adding a useful description to your runs using the command line “--r” followed by the description of the run.
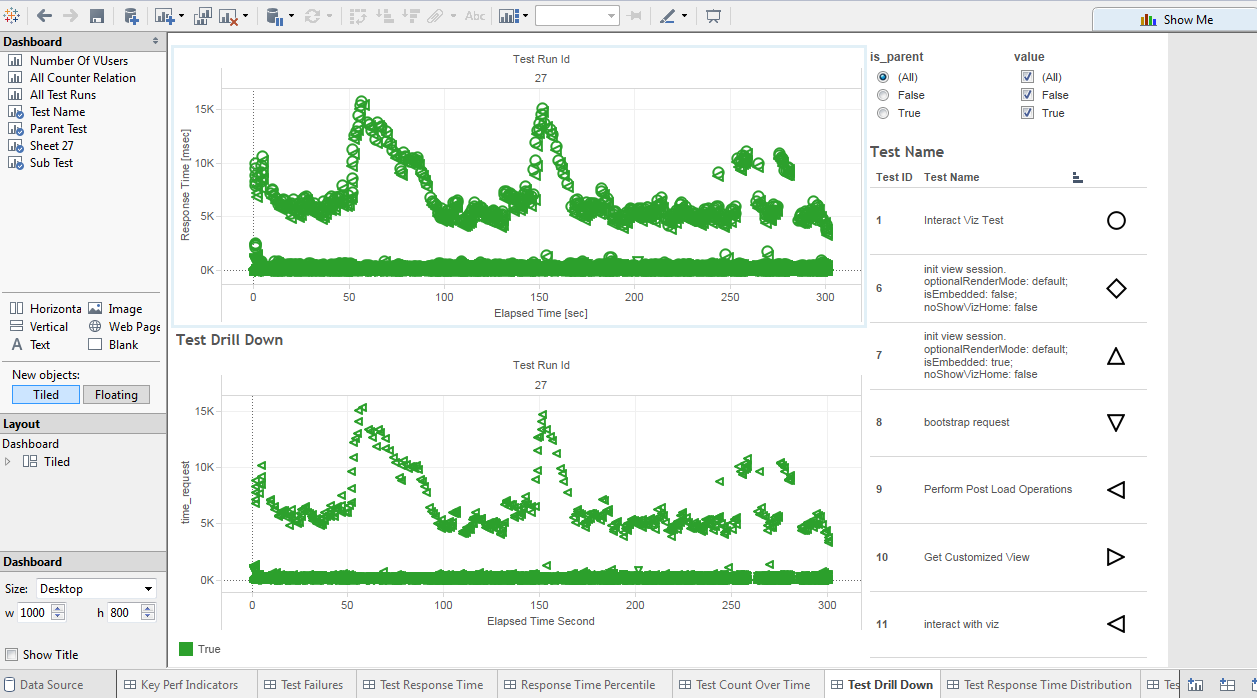
Analyzing results
Once the run is finished, open up the analysis workbook located at c:\tabjolt\PerformanceViz.twb using Tableau Desktop. You will need to provide the username and password for your TabJolt Postgres repository that you installed earlier (please see the installation guide on default credentials). You can update the default credentials in PerfRunHarness.Properties.
You can view the test results and review each of the worksheets.

Analyzing your load test data is like exploring any data with Tableau. TabJolt has some key worksheets as a starting point. Standard KPI metrics like response times, test cases per second (tps), host metrics, and JMX metrics (if configured) are visible in the workbooks automatically.
When you look at these results, you can quickly find patterns and check how your workload is behaving under load. In addition to standard metrics, TabJolt provides additional visibility and drill-down options for easier triage. Using these tools, you can find out which requests and tests are failing, and why.

Resources
If you're like me, you're probably excited to get your hands on TabJolt and give it a try. You can download all relevant files and the installation guide on GitHub. We have more information to help you get started in these training videos.
TabJolt is available as-is and not supported by Tableau. However, we expect you'll have questions. Please post your questions on the Tableau Server Administration forum with "TabJolt" as the subject. We're hopeful that many of you will start to build a community around this tool and share what you learn.
You can also tweet me your questions and comments @neeleshkamkol, and follow me for future updates on the project.
Related Stories

How EMD Serono is improving patient care with personalized, AI-powered insights from Tableau
 September 30, 2024

Embedded Analytics: Should you build or buy?
 June 7, 2022

Data fabric’s value to the enterprise
 May 11, 2022