
Statista’s European industry comparison benchmark study
Step 1: Download Tableau
Tableau is business intelligence software that helps anyone see and understand their data. Download the free, 14 day full-version trial of Tableau, and visualize your data set in hundreds of new ways. You can filter, add calculations, and investigate the underlying details to discover more.
Full-version trial. No credit card required.
Step 2: View the study in Tableau
To visualize the results and ask more questions about the study, download the data and workbook and view it in a free trial of Tableau.
About the data set
Statista’s European industry comparison benchmark study
This study includes European employment and GDP data, by both segment and industry, broken down by country. For the purpose of this study, a segment represents a specific subdivision of the economy, in which various industries are contained.
This up-to-date industry report will assist you in answering questions such as:
- Which segment and/or industry in the European market represents the largest portion of GDP?
- Which country contributes to the greatest portion of GDP as a whole, or by a specific sector or industry?
- What country provides the greatest employment opportunities in a specific segment and/or industry?
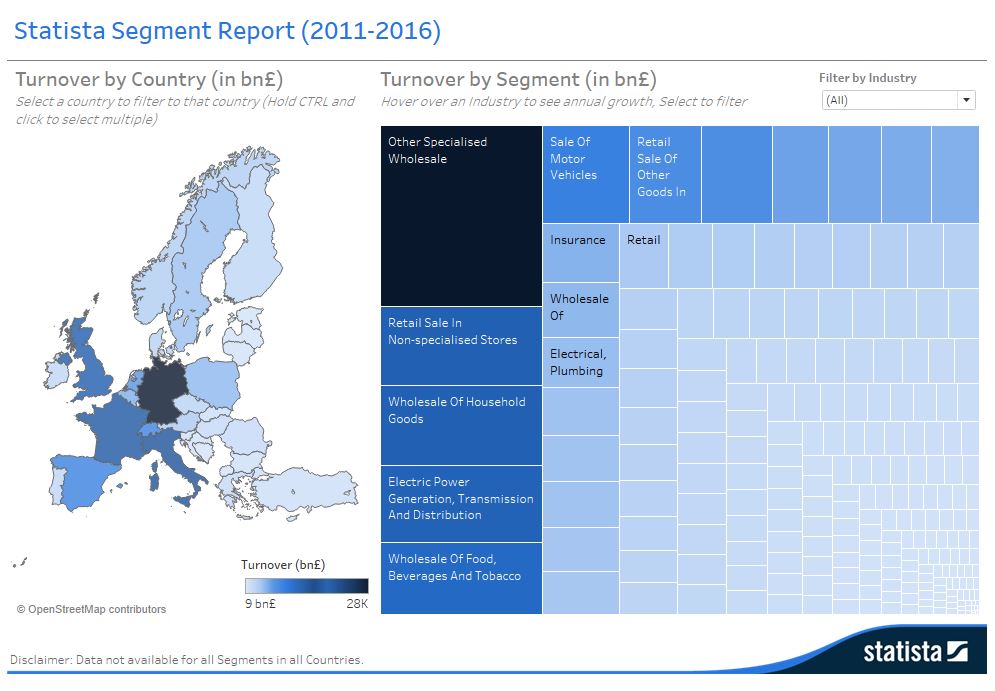
Tableau is one of the best tools out there for creating really powerful and insightful visuals. We’re using it for analytics that require great data visuals to help us tell the stories we’re trying to tell to our executive management team.
Tableau를 믿고 사용하는 고객사:


