Professional Interactive Excel Charts
Full-version trial. No credit card required.
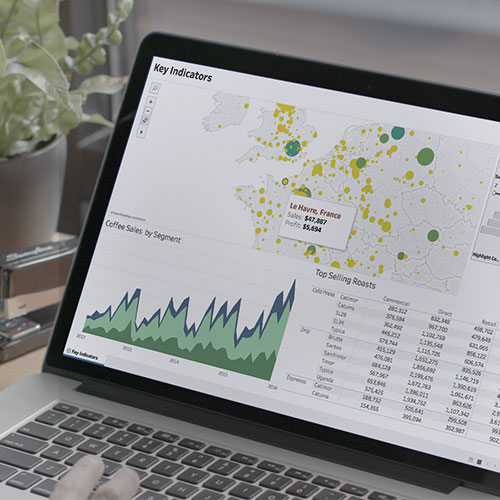
Tableau charts are interactive, helping everyone to get answers—and showing trends and outliers that are invisible in basic charts.
Get insight fast
Leverage your natural ability to spot visual patterns quickly. Experience analytics built for speed and ease of use.
Connect to all your data
Whether it’s in a spreadsheet, a SQL database, Hadoop, or the cloud, you can connect to any data, anywhere.
Explore and discover
Ask new questions, spot trends, identify opportunities, and make data-guided decisions with confidence.
Tell powerful stories
Create interactive presentations. Control the narrative while allowing your audience to explore.
Answer deeper questions
Real analytics demands more than a pretty dashboard. Experiment with trend analyses, regressions and correlations.
Share in seconds
Publish a dashboard with a few clicks to share it live on the web and on mobile devices.
Full-version trial. No credit card required.


경영진과의 첫 번째 회의에 Tableau로 작성한 대시보드를 가져갔을 때 이전에는 별로 반응을 보이지 않았던 일부 참석자들마저도 매우 놀라워했습니다. 경영진 중 한 분은 "저는 BI 분야에 이러한 기능을 요구해 왔습니다. 마침내 해냈군요."라고 말했습니다.
게시 매체