Optimizing your Amazon Redshift and Tableau Deployment for Better Performance
Download this free whitepaper
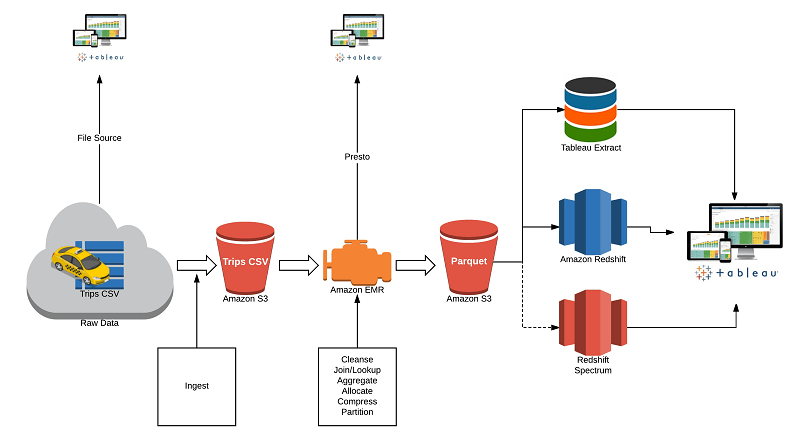
Amazon Redshift and Tableau are two powerful technologies in a modern analytics toolkit. Combined, they form a data warehousing and analytics solution that allows users to analyze datasets, running into the billions of rows, with speed and agility to drive better business outcomes. They are integrated out-of-the-box, so you can connect Tableau to your Amazon Redshift data warehouse with minimal time or effort. It’s important to understand how to optimize when integrating the two together, and doing so can yield considerable performance gains and ultimately shorten deployment cycles.
This paper introduces infrastructure advice as well as tips and hints to make the joint solution more efficient and performant.
Get the whitepaperWhat's really going to make big data go mainstream is the ability to connect not just with data scientists and technologists but business people. And absolutely one of the keys to that is visualization, is being able to show people—not just tell people, not just show numbers or even show charts—but to have those charts and graphs and visualizations come alive.