Introducing the Tableau Foundation's Living Annual Report


Note: This piece first ran on Glasspockets.
Maybe it is the headlines from the campaign trail, but I’ve spent a lot of time lately thinking about philanthropy, impact, and accountability.
As the head of the Tableau Foundation, I’m responsible for ensuring that we embody the values our employees have entrusted us to uphold. My team and I are accountable to the thousands of people who make up Tableau, and to the tens of thousands of Tableau customers and partners who are passionate about using data to drive change.
The question I’ve been wrestling with is not whether we should tell our story, but how. How can we share what’s been accomplished in a way that is both timely and true without taking credit for someone else’s work? Moreover, how can we do all of this while still being a good steward of the company’s resources?
That's why I’m pleased to share the Tableau Foundation’s brand new Living Annual Report. We’ve ditched the traditional, glossy-printed annual report for a live report so anyone can get near-real-time information on what we’re doing around the globe.
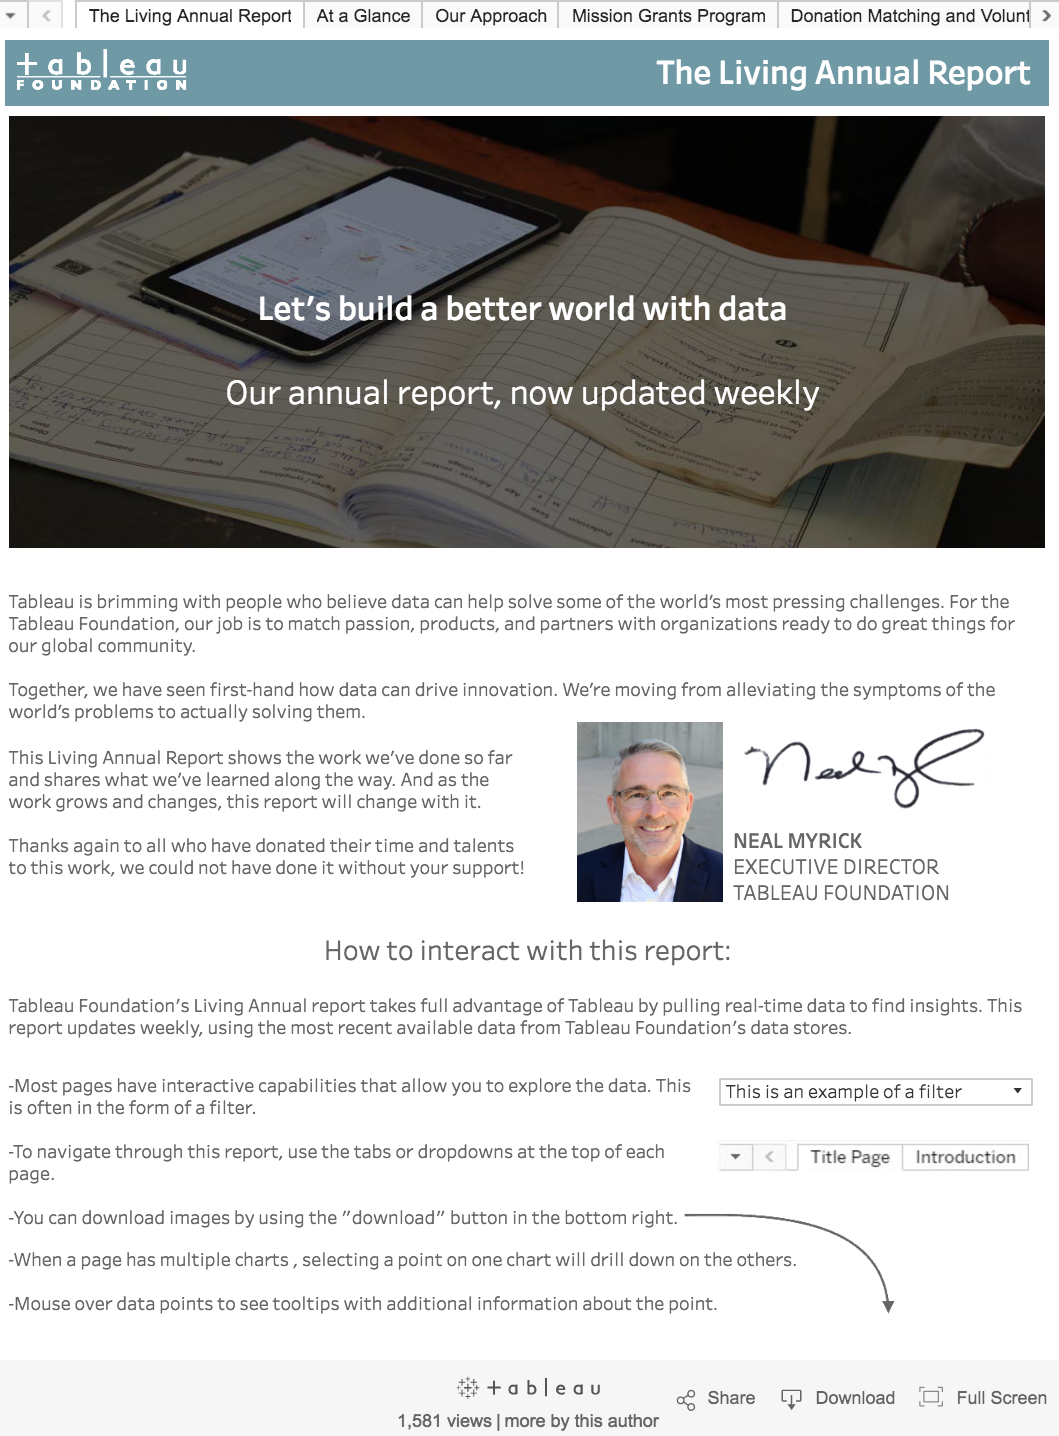
The Living Annual Report gives our stakeholders better, more timely information while reducing the investments of staff time and resources of a traditional printed report. It pulls information from the same data sources we use every day. The report updates weekly, and most pages have interactive capabilities that allow anyone to explore the data.
The report doesn’t just take look back at what we’ve done, either. It is also helping us chart the course ahead.
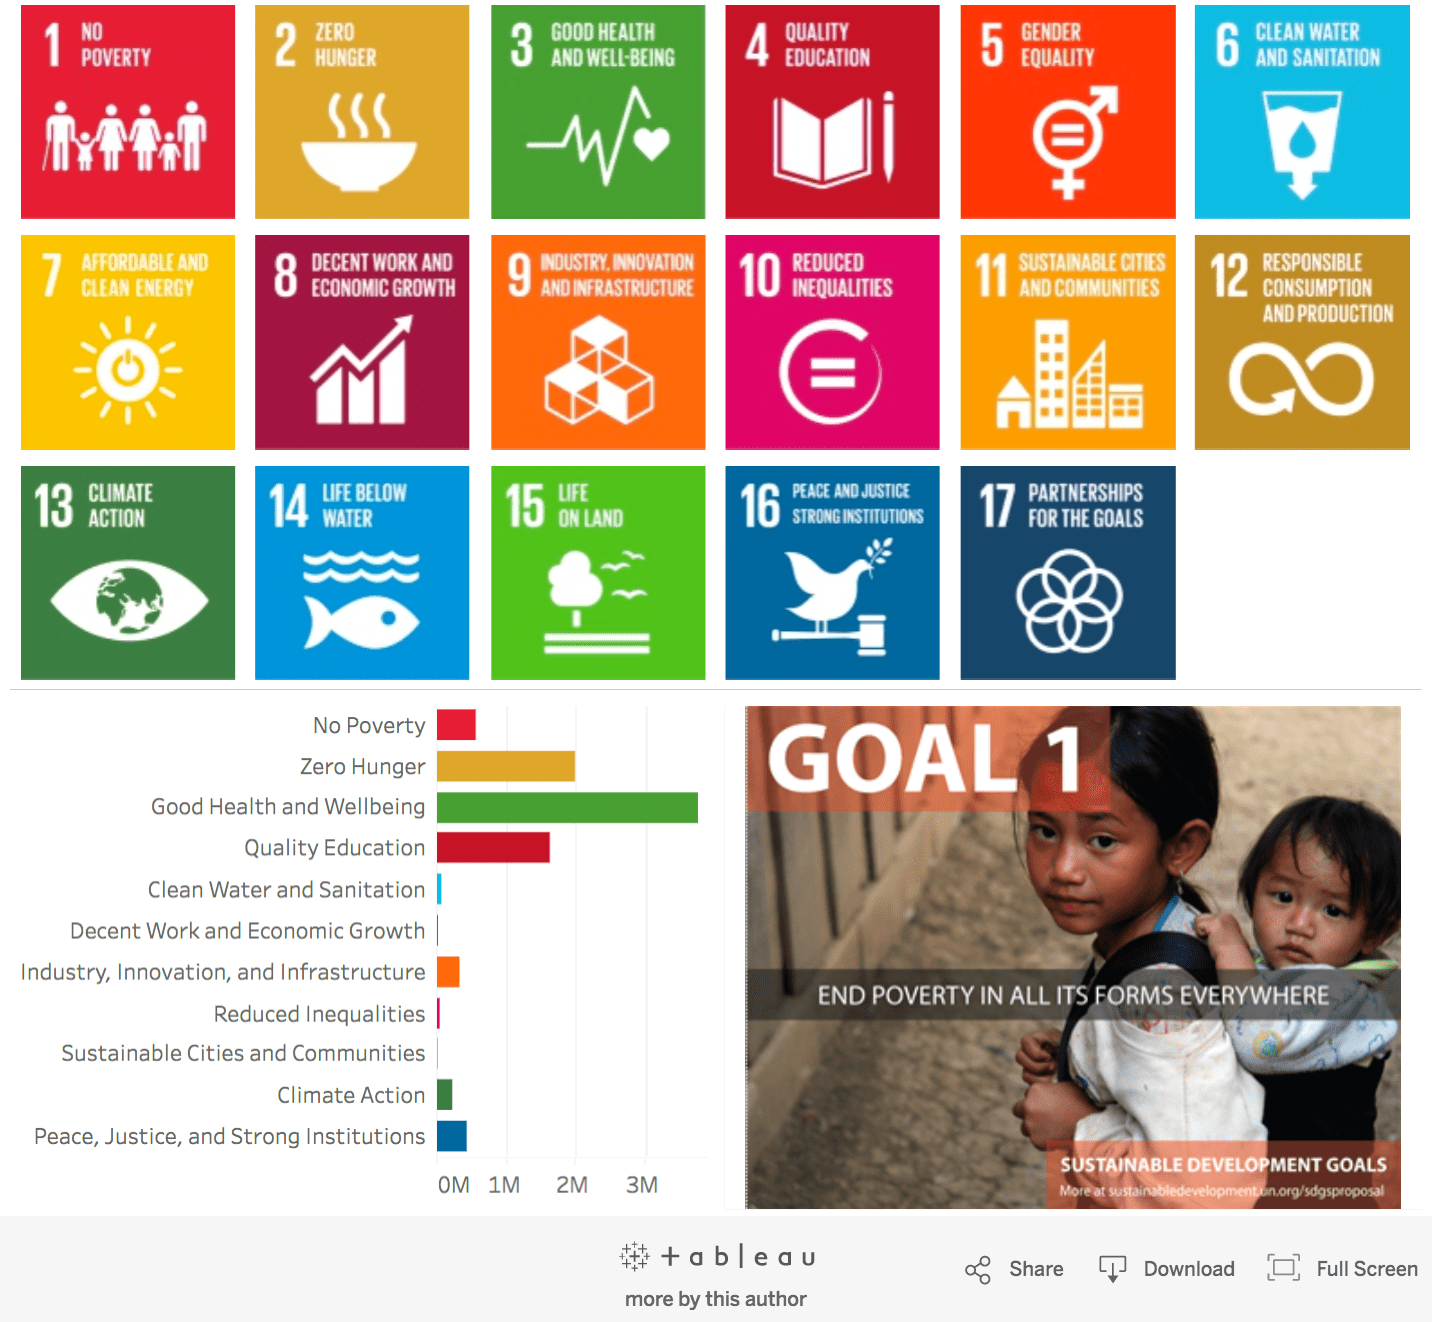
Earlier this year we adopted the UN’s Sustainable Development Goals (SDG) as a framework for setting our priorities and measuring progress. While the 17 goals themselves are expansive, the 230 underlying indicators help us organize our activities and approach partnerships with a clear sense of what we’re trying to achieve.
We recognize that we’re capacity builders and that the issues we’re trying to effect require much larger collaborative efforts. After all, the problems we’re trying to solve are multidimensional, so why should the solutions be different?
Almost immediately, real-time transparency around priorities led to more relevant and constructive conversations with potential partners. We are finding more opportunities to deploy our two most valuable resources—our products and our people—to help people around the globe use facts and data to solve some of the world’s toughest challenges.
And somewhere in putting the report together, it became something bigger. We started to see the report as a model that shows foundations and non-profits that they don’t have to spend substantial resources printing reports that are outdated the moment they are printed.
The purpose of a foundation or non-profit’s annual report is to persuade decision-makers—funders, board members, partners, lawmakers—to take action. But if the information in the report is outdated, how can those people make choices that lead to real impact?
This is not to say we should sacrifice storytelling. On the contrary, interactive charts and graphs sitting seamlessly alongside photos, videos, testimonials, and one-click calls to action can create a holistic engagement experience far beyond what a static printout might do.
My real hope is that our report will inspire others to ditch the glossy paper and to get on board with the real purpose of the report—sharing actionable, up-to-date information with those in a position to take action. Some already have. The Heron Foundation has been reporting on their portfolio through data visualizations for several years now.
The Foundation Center’s Glasspockets transparency assessment tools and Foundation Maps are bringing sector-wide insights to grantmaking. And after seeing our Living Annual Report, others tell me they’re not far behind.
Imagine talking to a development director, for example, and being able to explore an interactive, near-real-time annual report to help you understand how your investment is having impact—not “as of last May” when a traditional annual report would have been printed, but as of last week. As a funder, we can and should lead by example.
Which brings me back around to the idea of impact and accountability. To do our work well, we have to share timely information. This means sharing what we are doing, showing how our resources are being spent, and being responsible for the progress—or possibly lack thereof.
This level of accountability can be uncomfortable sometimes. But it's necessary to establish more constructive partnerships based on trust, set ourselves up to learn from the data, and ultimately do more impactful work.
As the work grows and changes, this report will change with it. And we’re continually making improvements and all suggestions are welcome. Feel free to email us anytime at foundation@tableau.com with any feedback.
Related Stories
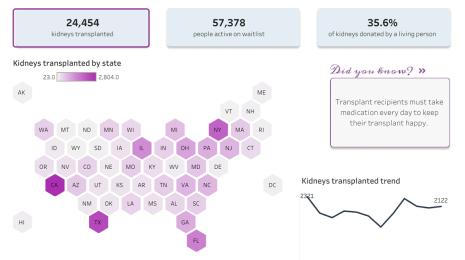
From Kidney Donation to Tableau Dashboard
 October 25, 2022

Using data to drive conversations about climate change
 April 28, 2022