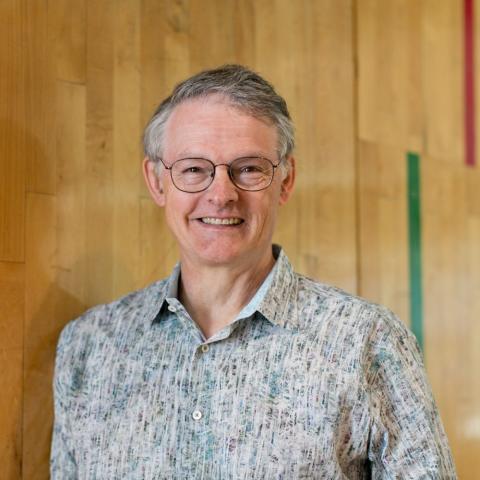
Jock Mackinlay
Technical Fellow

Lucky to have a long research career related to Tableau’s mission
About
Jock D. Mackinlay is the first Technical Fellow at Tableau Software. He believes that well-designed software can help a wide-range of individuals and organizations work effectively with data, which will improve the world. He is an expert in visual analytics and human-computer interaction who joined Tableau in 2004 after being on the PhD dissertation committee of Chris Stolte, one of the cofounders of Tableau.
Mackinlay received his BA in Mathematics and Computer Science from UC Berkeley in 1975 and his PhD in Computer Science from Stanford University in 1986. His PhD dissertation described how to automatically generate graphical presentations of relational information including bar charts, scatter plots and node/link diagrams. Inspired by Jacques Bertin, he developed a composition algebra to generate a wide variety of graphical presentations and evaluation criteria to identify effective presentations.
In 1986, Mackinlay joined the Xerox Palo Alto Research Center (PARC), where he collaborated with the User Interface Research Group to develop many novel applications of computer graphics for information access, many inspired by his composition algebra. His key mentors were Stuart K. Card and George G. Robertson. They published three influential papers at the ACM CHI’91 conference on their prototype system called the Information Visualizer. This prototype included the Cone Tree, an animated 3D node-link visualization of hierarchical information, and the Perspective Wall, a 3D focus+context technique that was effective for temporal analytics. In 1999, he co-wrote the book Readings in Information Visualization: Using Vision to Think with Stuart K. Card and Ben Shneiderman.
While working on the visualization book, Mackinlay also collaborated with Polle Zellweger and Bay-Wei Chang on Fluid Documents, which used interactive animation to embed annotations, images, and rich links in documents. In 2000-2001, he took a sabbatical at the University of Aarhus as a visiting professor. Mackinlay, Zellweger and Danish collaborators explored how to do fluid annotations with open web standards. Mackinlay taught a course in Information Visualization based on his newly published book. Mackinlay and Zellweger also taught a course on the user interface of mobile devices. The mobile device course led directly to a 2003 paper on contextual views in minimal space, which was research done at PARC after the sabbatical. After returning to PARC from Denmark, Mackinlay focused on exploiting advances in flat panel displays and graphics cards that enabled personal computers with 6-8 monitors. He described how to design visual analytics applications using wideband visual interfaces that fill the human visual field. He implemented several novel user interface techniques for creating seam-aware applications that target wideband displays based on multiple monitors.
Toward the end of his time at PARC, Mackinlay was also a member of the PhD dissertation for Chris Stolte, who was working with Stanford Professor Pat Hanrahan on the visual analysis and exploration of large, complex databases. Stolte and Hanrahan developed the VizQL specification language for data views, which extended Mackinlay’s composition algebra. After graduation in 2003, Stolte. Hanrahan, and Christian Chabot co-founded Tableau Software to commercialize this research.
Mackinlay’s primary focus at Tableau has been the direction forward for the products, particularly in the areas of visual analytics and human-computer interaction. He is an inventor on numerous patents involving visual analytics and human-computer interaction. In 2005, Mackinlay and Hanrahan added the Show Me feature to Tableau v1.5, which finally incorporated results from Mackinlay’s dissertation into a commercial application. In 2009, Mackinlay received the Visualization Technical Achievement Award from the IEEE Visualization and Graphics Technical Committee for his seminal technical work on automatic presentation tools and new visual metaphors for information visualization. In 2011, he started the Design Team, the User Research team, and a small “Bell Labs style”industrial research team at Tableau.
Áreas de interés
- Algorithms for Automated Graphical Design of Visualizations
- Data Storytelling
- Perception and Cognition
- Visualization Techniques
- Computer Graphics