The links at the right will take you to complimentary copies of the reports. Read on for our analysis.
Gartner Key Findings Include Positioning Tableau as "Challenger"
In the 2012 Gartner Magic Quadrant report, Garner positioned Tableau as a "Challenger" which is based on "Ability to Execute" and "Completeness of Vision." Other key findings from the Gartner Magic Quadrant report include:
- “The demand side of the BI platform market was defined by an intensified struggle between business users' need for ease of use and flexibility on the one hand, and IT's need for standards and control on the other.”
- “With ‘ease of use’ now surpassing ‘functionality’ for the first time as the dominant BI platform buying criterion in research conducted for this report, vocal, demanding and influential business users are increasingly driving BI purchasing decisions, most often choosing easier to use data discovery tools over traditional BI platforms — with or without IT's consent.”
- "BI tools must be simple, mobile and "fun" in order to expand use and value... BI tools must be intuitive to use without the need for IT assistance. Ease of use was the No. 1 driver of purchasing in 2010 and will only accelerate as a key requirement in the future."
These are findings that we're seeing directly among our customers and prospects. The people who have to make decisions with data want business intelligence software that is easier to use - even fun, is faster in producing results and doesn't require heavy IT intervention.
BI Platforms User Survey, 2011: Customers Rate their BI Platform Functionality
BI Platforms User Survey, 2011: Customers Rate their BI Platform Vendors
Figure 1. Gartner Magic Quadrant 2011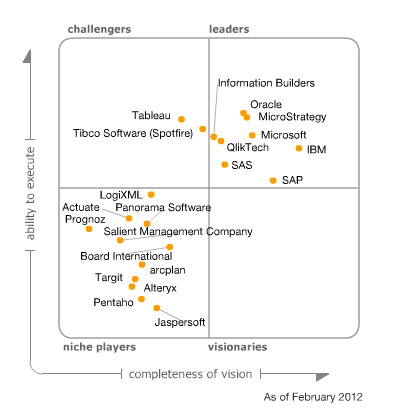
Source: Magic Quadrant for Business Intelligence Platforms" 27 January 2012, Rita L. Sallam, James Richardson, John Hagerty, Bill Hostmann, Gartner Research Note G00210036
Gartner Says Business Users Heavily Driving BI Decisions, Demanding Ease of Use
In the report, “BI Platforms User Survey, 2011: Customers Rate their BI Platform Functionality”, the first graph is “Overall Product Score vs Ease of Use”. It places 28 vendors on 2 axes: the x axis is customers’ composite ratings of product functionality (which is based on 13 business intelligence capabilities) and the y axis is their ratings of ease of use.
We chose to highlight this because of a noteworthy analytical insight from Gartner. “’Ease of use’ is now the No. 1 reason why organizations select a BI platform — surpassing ‘functionality,’ which has traditionally been the No. 1 reason.” People being able to use their business intelligence software is more important than the specific functions the software provides.
To us, that’s not surprising. We spend a lot of time on making sure product capabilities are usable – after all, if we build a feature people can’t use easily, they won’t use that feature. This likely explains Tableau’s position in the graph.
Gartner takes it even further: they say that by driving BI purchasing decisions, business users are choosing easier to use tools over traditional BI platforms. To quote:
“…Vocal, demanding and influential business users are increasingly driving BI purchasing decisions, most often choosing easier to use data discovery tools over traditional BI platforms — with or without IT's consent.”
Figure 2. Overall Rating of Business Intelligence Platform Capabilities in Meeting Needs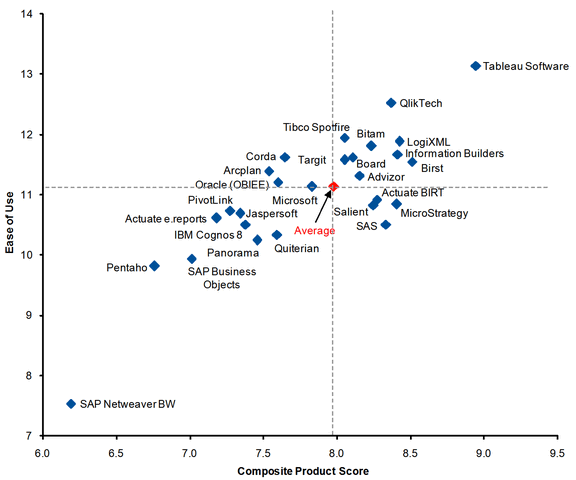
Source: BI Platforms User Survey, 2011: Customers Rate their BI Platform Functionality, 31 March 2011, Rita L. Sallam, Gartner Research Note G00211770
What Capabilities Do People Want in their BI platforms?
Some of the most interesting findings in the Gartner reports are organizations’ ratings of the 13 capabilities Gartner says define a BI platform, which you can find in the Magic Quadrant Report for Business Intelligence Platforms, 2011. The graphic below shows not only the most used capabilities but also the ones that are being adopted the fastest.
Figure 3. Overall Rating of Business Intelligence Platform Capabilities in Meeting Needs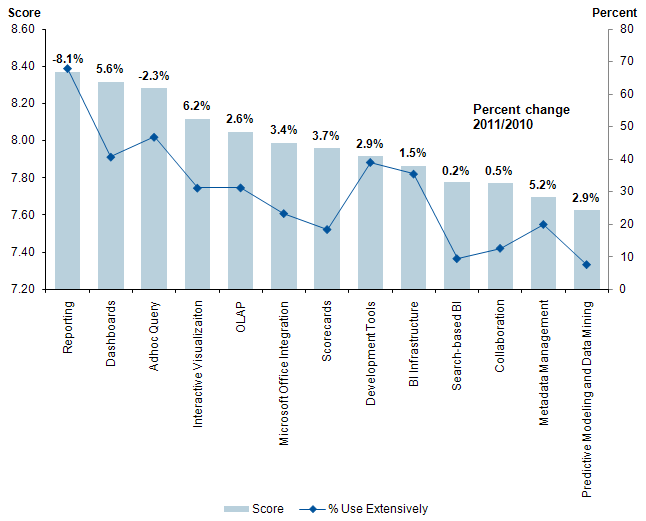
Source: BI Platforms User Survey, 2011: Customers Rate their BI Platform Functionality, 31 March 2011 , Rita L. Sallam, Gartner Research Note G00211770
Reporting
The most important capability continues to be reporting, even though its overall use is down. Tableau users agree – when you look at the vendor rankings for Reporting, you can see Tableau customers use it quite extensively (although not as much as customers of traditional BI vendors).
Figure 4: Satisfaction and Usage: Reporting (ibid.) 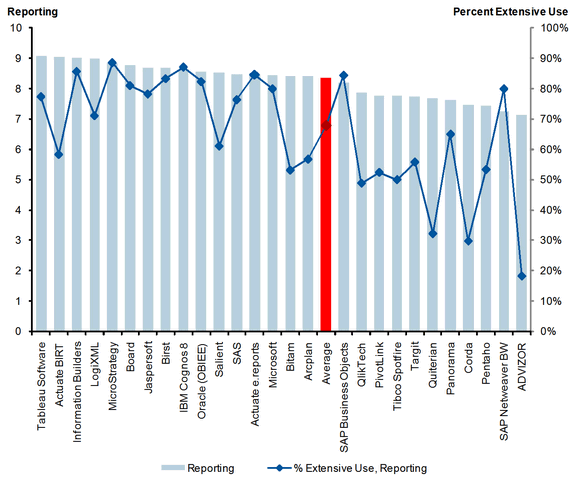
(Note: Chart represents customer perception and not Gartner's opinion.The chart may feature vendors that (in Gartner's opinion) do not deliver the functional capability described.N=1,127.)
Dashboards and Interactive Visualization
Let’s look at the fastest growing capabilities: Dashboards and Interactive Visualization. Gartner comments “Use of reporting and ad hoc analysis experienced the most significant decline in extensive use while interactive visualization and dashboard use grew the most. These results suggest that many enterprises are moving beyond a focus on measurement of the past.”
Tableau users obviously know this – this is clear not only from how they rated Tableau in both Dashboards and Interactive Visualizations but in the percentage of them that are using Tableau heavily for those features.
Figure 5: Satisfaction and Usage: Dashboards (ibid.) 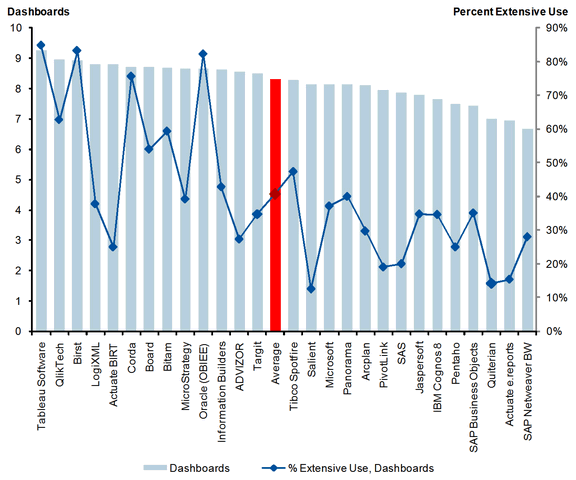
(Note: Chart represents customer perception and not Gartner's opinion.The chart may feature vendors that (in Gartner's opinion) do not deliver the functional capability described.N=1,127.)
Figure 6: Satisfaction and Usage: Interactive Visualizations (ibid.) 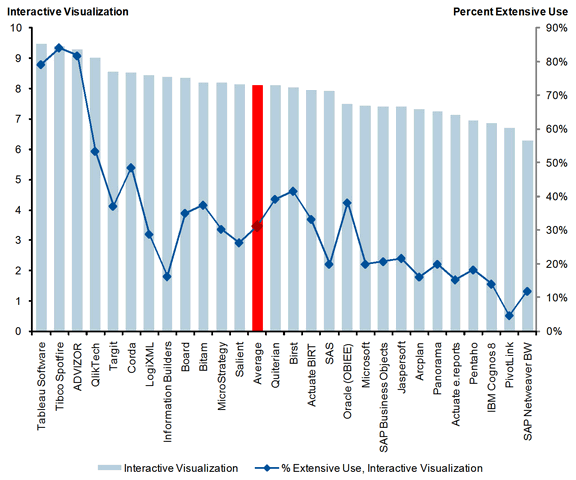
(Note: Chart represents customer perception and not Gartner's opinion.The chart may feature vendors that (in Gartner's opinion) do not deliver the functional capability described.N=1,127.)
Metadata
With respect to metadata management, even as it grows quickly, it still has relatively low usage. A key point of Gartner’s analysis is that because an increasing number of deployments are using data discovery tools, those BI platforms do not require a full-on enterprise semantic layer — users can access and combine data sources directly. To end users who do need metadata management, we feel having the Tableau-style capability to access, combine and manipulate data sources directly appears to be a type of metadata management they like – check out how customers rated Tableau on metadata management.
We think our ratings are well-reflected in a recent comment from a customer. After seeing Tableau create a data source, add a hierarchy on the fly, rename several dimensions, add comments to those dimensions to clearly identify what was renamed, drag a measure field to become a dimension field, hide a few fields, and then publish the data source with the metadata changes so it could be shared across his team, the customer reacted with disbelief and called it "metadata in minutes."
Figure 7: Satisfaction and Usage: Metadata Management (ibid.)
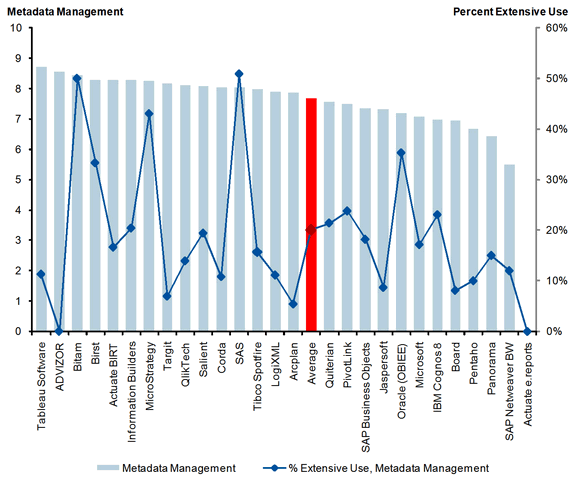
(Note: Chart represents customer perception and not Gartner's opinion.The chart may feature vendors that (in Gartner's opinion) do not deliver the functional capability described.N=1,127.)
Customer Experience
According to Gartner, “there does appear to be a direct correlation between sales and experience and overall customer experience.” Notice that there are no real “outliers” – vendors who have a great sales experience but terrible software/support quality, or vendors who have terrible sales experiences but great software/support quality.
Figure 8: Overall Customer Experience 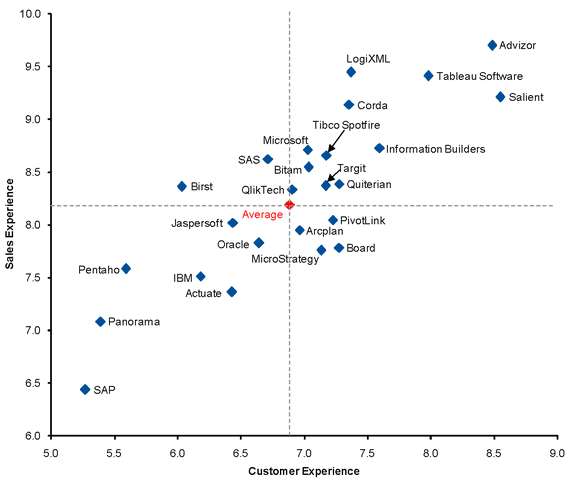
Source: BI Platforms User Survey, 2011: Customers Rate Their BI Platform Vendors31 March 2011 , Rita L. Sallam, Gartner Research Note G00211770
(Note: Chart represents customer perception and not Gartner's opinion.The chart may feature vendors that (in Gartner's opinion) do not deliver the functional capability described.N=1,127)
Overall Satisfaction and View of Vendor’s Future Go Hand in Hand
As many software buyers know, the overall satisfaction with a software provider is based on many dimensions including product quality, response times, business relationship, support quality, website resources, and so on. And in making a purchase decision, software buyers also know they are not just buying software for today; it likely is software that will be used for years to come. So having satisfaction with the vendor’s product of today and confidence in that vendor’s future is important.
In the graph below, Gartner states, “the Overall BI Platform Success score on the horizontal axis represents composite (aggregate) ratings for product capabilities, support, sales experience, product quality and performance, with equal weightings for each — the higher the composite score, the more positive the overall experience with the vendor. The vertical axis records responses to our question about whether respondents were more concerned about the vendor in 2010, more positive, or unchanged in their view.”
Tableau is gratified that our customers ranked us the way they did.
Figure 9: Satisfaction With Vendors, Change in Future Outlook and Average Business Benefits (ibid.)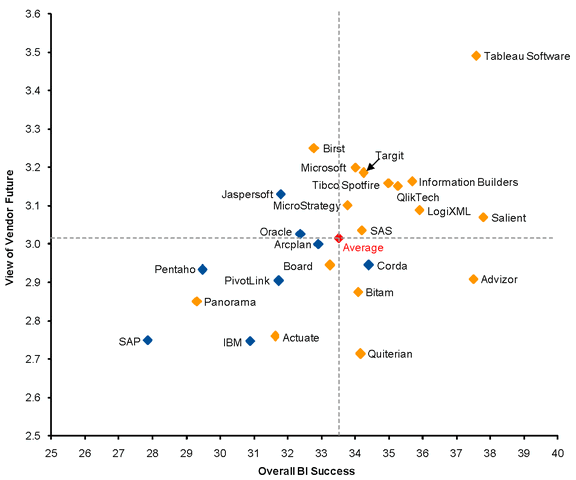
(Note: Chart represents customer perception and not Gartner's opinion.The chart may feature vendors that (in Gartner's opinion) do not deliver the functional capability described.N=1,127.)