DataFam Roundup: April 18 - 22, 2022


Welcome! Dig into this week's DataFam Roundup—a weekly blog that brings together community content all in one post. As always, we invite you to send us your content—and the DataFam content from your peers that have inspired you! Find the content submission form here.
DataFam content
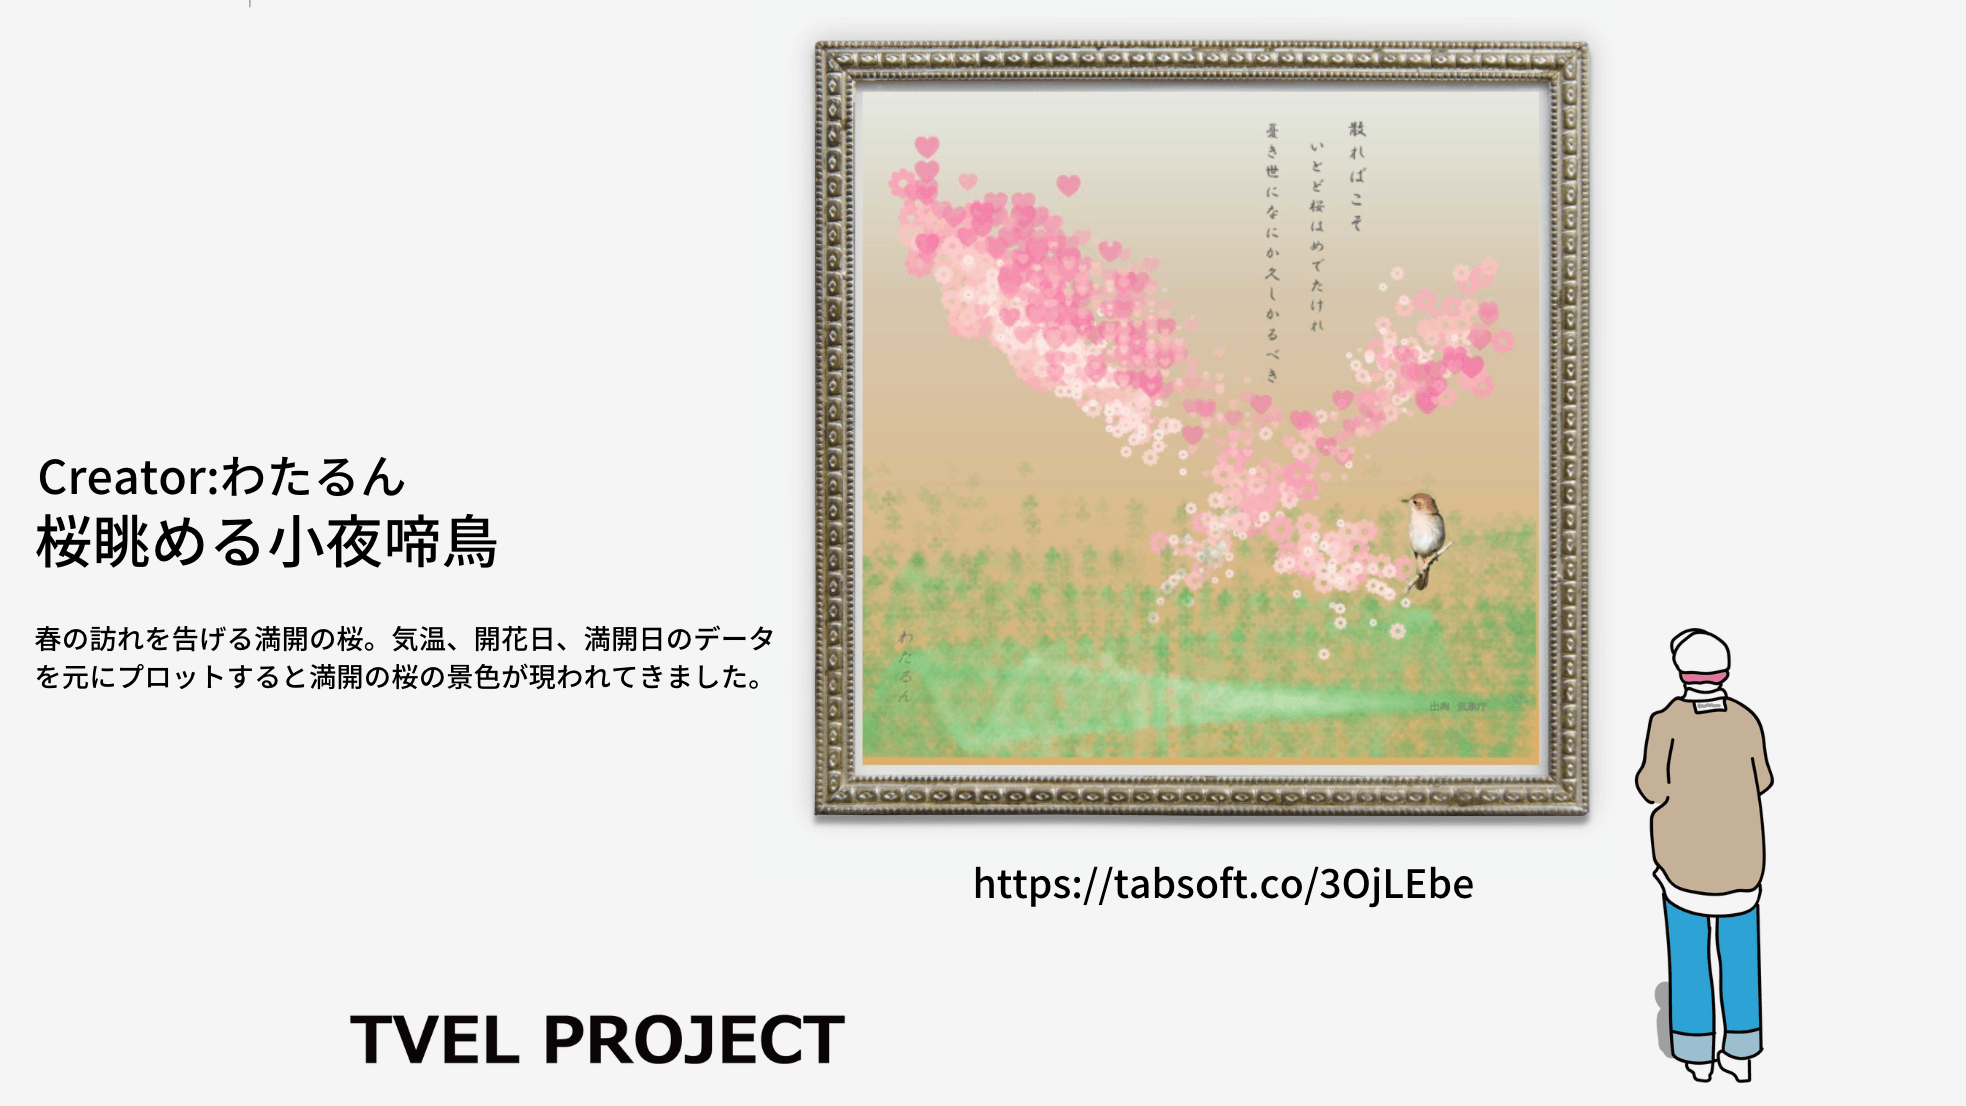
Vizzes featured from the physical Viz Gallery held in a local cafe in Tokyo 4/15 - 4/17
Dive into content created by the Tableau Community:
- Noriko Ooi: Tableau Viz Exhibition “Life” 〜日常にデータを』感想 Impressions of "Tableau Viz Exhibition" Life "-Data for everyday life" (Japanese)
- Vani Agarwal: How to add dimensions after measures without converting measures into discrete values
- Sarah Bartlett, Sarah Loves Data: Iron Quest Re-Viz-It – Recap
- Alex Eskinasy: Tableau Custom Views gone wild on embedded solution
- Zach Bowders, Data + Love: Select Top 5 - Tableau Conference Tips
- Adam Mico: #DataFam Tableau Wishlist
- Megan Menth, phData: How to Fine-Tune Your Data for Tableau
- Mateusz Karmalski, NewDataLabS: 60 wykresów w Tableau cz.4: relacje Scatterplot as a visualization of variable dependencies (Polish)
Team Tableau
Building data skills and community with Tableau’s Academic Programs Lunch and Learn sessions
- Who are the finalists of the 2022 Iron Viz Qualifiers?
- Job Listings on the Tableau Forums
- Building data skills and community with Tableau’s Academic Programs Lunch and Learn sessions
- Why repeat Iron Viz participants keep coming back for more
- Not Your Typical Data Visualization Collaboration
Upcoming events and community participation
- Data + Diversity: Tableau and the Neurodivergent Community: Tableau Community members Adam Mico and Hunter Hansen discuss their autistic experience in the context of Tableau and the broader data community.
- Stay up to date with the latest and greatest from the Tableau Community. We'll help you along in your Tableau journey, bring your data skills to the next level, and nurture powerful connections.
- Sign up to be a panelist for the 3charts@3 Live: A Mystery Chart Show featuring topics like personal finance, energy, healthcare and more!
- Calling all DataDevs: Join Tableau at TrailblazerDX 2022, April 27–28 in San Francisco—or virtually from anywhere—to boost your skills and celebrate with other builders, creators, and makers.
- Your Future in Data Analytics, Maggy (Martina) Muellner: aims to support the next generation of DataFam members in gaining/improving their Tableau skills, support them in making their resume "hire friendly" and give advice on personal marketing on LinkedIn.
- Data Book Club, Spring 2022 Selection: Upstream: The Quest to Solve Problems Before They Happen by Dan Heath
- My Tableau Story with Visionary Jim Dehner: Join us to get inspired by Jim's Tableau story and hear his advice on charting your personal path through the Community. He'll highlight how User Groups are a powerful resource for building your support network and data skills.
- The 2022 Vizzies Award Nominations: The Tableau World Podcast established the Vizzies as a way to recognise individuals in the Tableau community who are not recognised through the visionary program. It is our goal that these awards are diverse and inclusive of the Tableau community. Nominations are open through May 6th. Winners will announced live on stage at TC22!
Vizzes
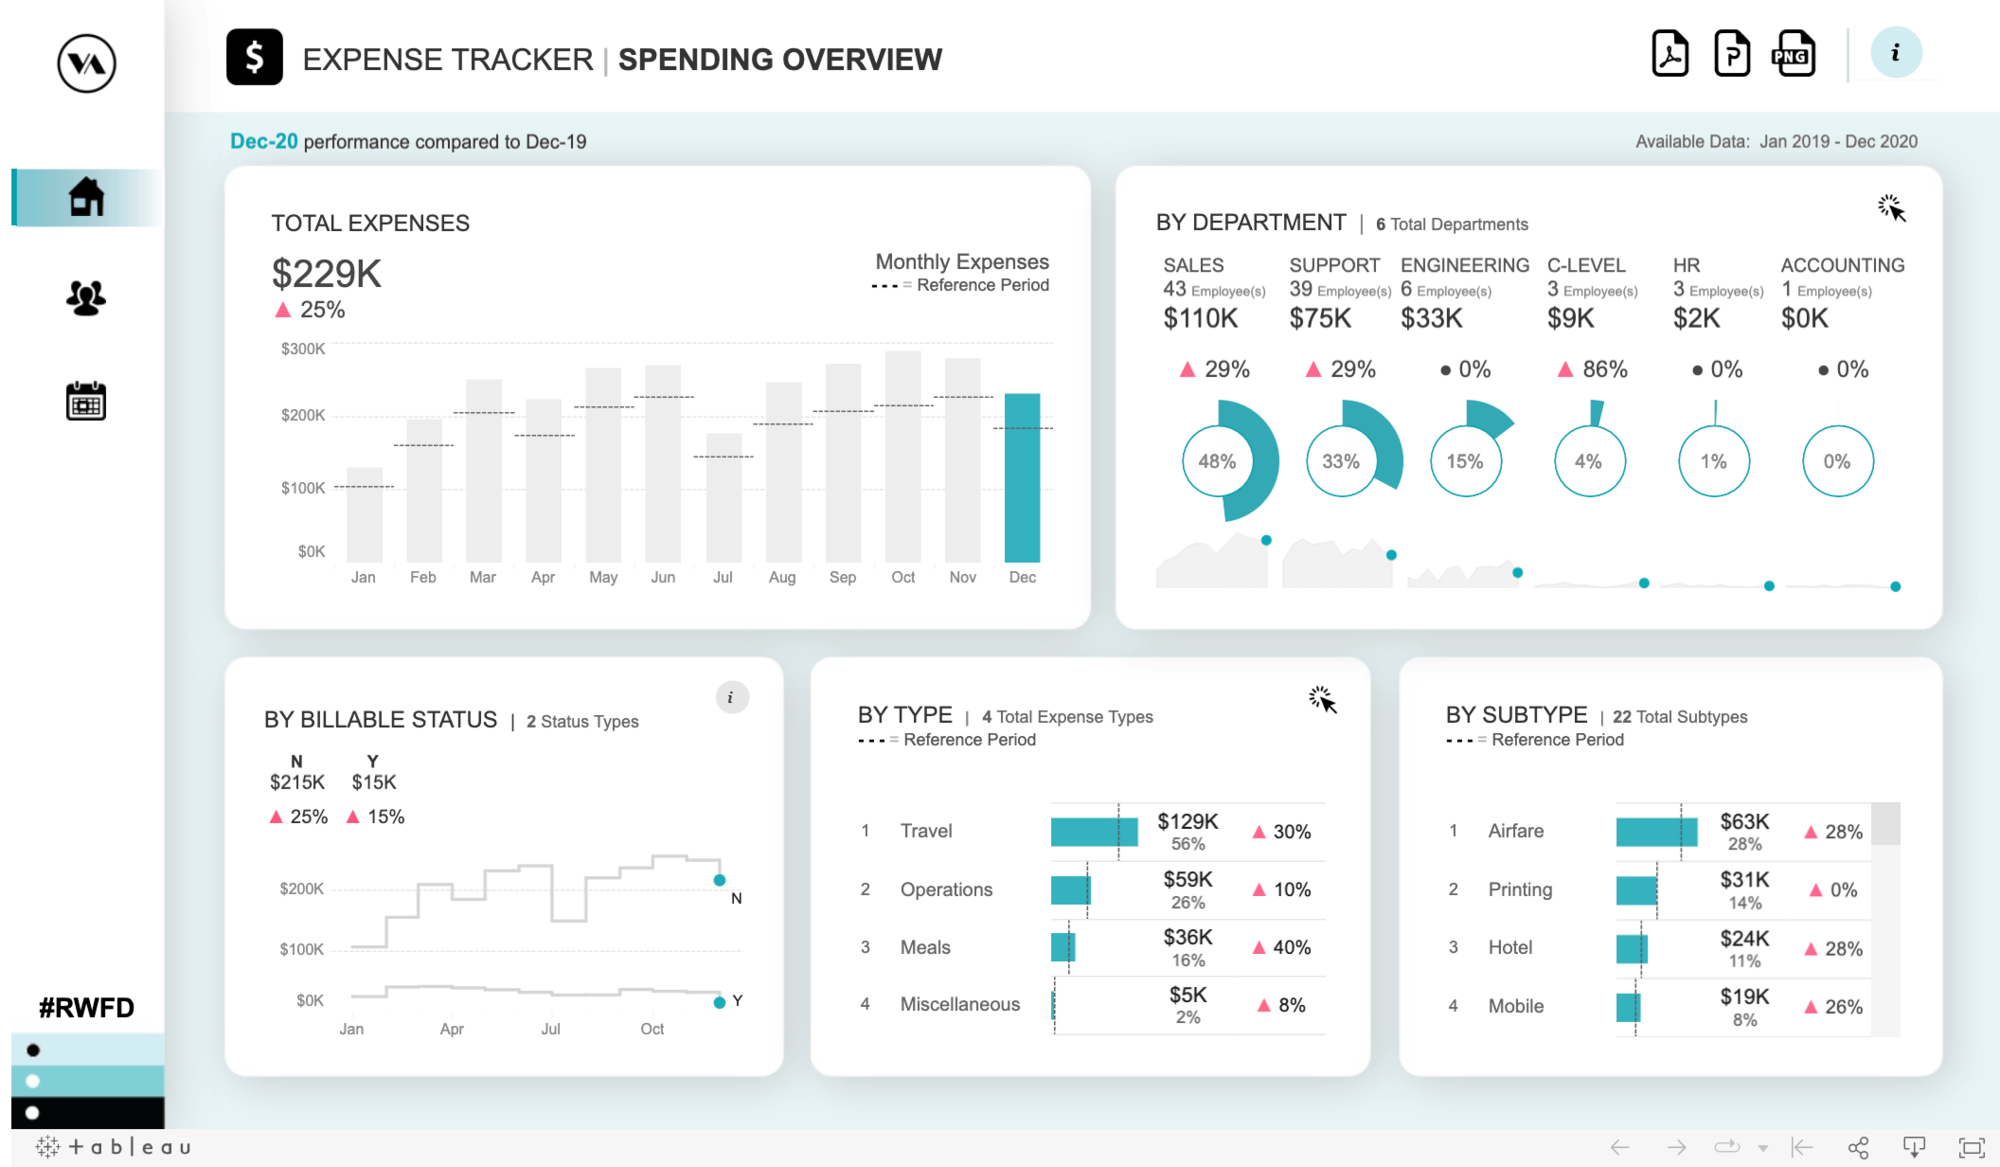
Chimdi Nwosu: #RWFD - Business Expense Dashboard
See the latest Viz of the Day, trending vizzes, featured authors, and more on Tableau Public.
Check out some inspirational vizzes created by the community:
- Lan Ha: #DiversityinData | Female Workforce Participation - World Bank's Reports
- Chimdi Nwosu: #RWFD - Business Expense Dashboard
- Luke Abraham: Municipal Waste | #B2VB Build a Heat Map
Community Projects
DataFam Con
A monthly challenge covering pop culture and fandoms.
Web: DataFam Con
Twitter: #DataFamCon
February 2022: Toss a Coin to your Witcher …
EduVizzers
A monthly project connecting real education data with real people.
Web: Eduvizzers
April 2022:
- Level 1 dataset: Austin High School Graduation Rates
- Level 2 dataset: Austin Schools Rated as Improvement Required
Back 2 Viz Basics
A bi-weekly project helping those who are newer in the community and just starting out with Tableau. Not limited just to newbies!
Web: Back 2 Viz Basics
Twitter: #B2VB
Week 8: Build a Heat Map
Data Plus Music
A monthly project visualizeing the data behind the music we love!
Web: Data Plus Music
Twitter: #DataPlusMusic
February 2022: MIDI Music Analysis
Games Night Viz
A monthly project focusing on using data from your favorite games.
Web: Games Nights Viz
Twitter: #GamesNightViz
May 2022: Level 4: The Need for Speed
Workout Wednesday
Build your skills with a weekly challenge to re-create an interactive data visualization.
Web: Workout Wednesday
Twitter: #WOW2022
Week 16: Can you make a Hexbin Map?
Preppin' Data
A weekly challenge to help you learn to prepare data and use Tableau Prep.
Web: Preppin’ Data
Twitter: #PreppinData
Week 15: Restaurant Orders
Iron Quest
Practice data sourcing, preparation, and visualization skills in a themed monthly challenge.
Web: Iron Quest
Twitter: #IronQuest
March 2022: Music Firsts
Storytelling with Data
Practice data visualization and storytelling skills by participating in monthly challenges and exercises.
Web: Storytelling with Data
Twitter: #SWDChallenge
April 2022: rebrand it!
Project Health Viz
Uncover new stories by visualizing healthcare data sets provided each month.
Web: Project Health Viz
Twitter: #ProjectHealthViz
January 2022: One Year of Sleep
Diversity in Data
An initiative centered around diversity, equity & awareness by visualizing provided datasets each month.
Web: Diversity in Data
Twitter: #DiversityinData
March 2022: Refugees in Ukraiune and Women in the Global Workforce
SDG Viz Project
Visualize data about Sustainable Development Goals provided by the World Health Organization.
Web: SDG Viz Project
Twitter: #TheSDGVizProject
Sports Viz Sunday
Create and share data visualizations using rich, sports-themed data sets in a monthly challenge.
Web: Sports Viz Sunday
Twitter: #SportsVizSunday
April 2022: Indy 500
Viz for Social Good
Volunteer to design data visualizations that help nonprofits harness the power of data for social change.
Web: Viz for Social Good
Twitter: #VizforSocialGood
Real World Fake Data
Create business dashboards using provided data sets for various industries and departments.
Web: Real World Fake Data
Twitter: #RWFD
Session 2: SAP Concur (Employee Expenses)
Viz 2 Educate
Each month, create vizzes on global education syllabus topics as resources for teachers worldwide.
Web: Viz 2 Educate
Twitter: #Viz2educate
February 2022: Food & Nutrition
Makeover Monday
Join the community every Monday to work with a given data set and create better, more effective visualizations.
Web: Makeover Monday
Twitter: #MakeoverMonday
相關文章

DataFam Roundup: April 8–12, 2024
 2024/04/12
DataFam Roundup: April 1–5, 2024
2024/04/05
DataFam Roundup: March 25–29, 2024
2024/03/29
Subscribe to our blog
在收件匣中收到最新的 Tableau 消息。