Explore the 2019 Iron Viz entries on agriculture data


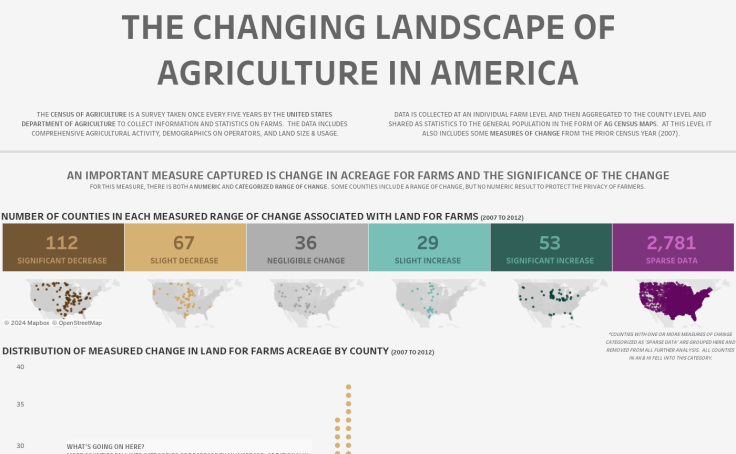
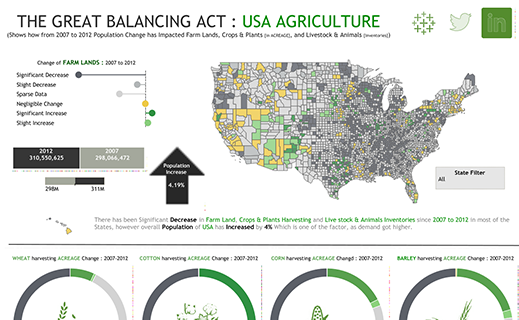
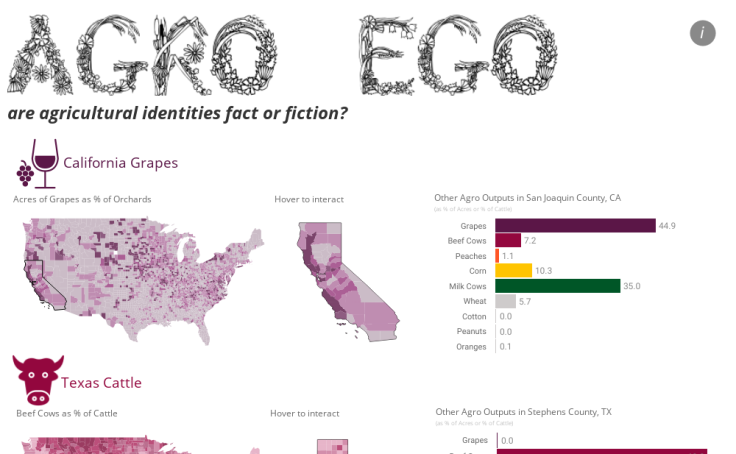
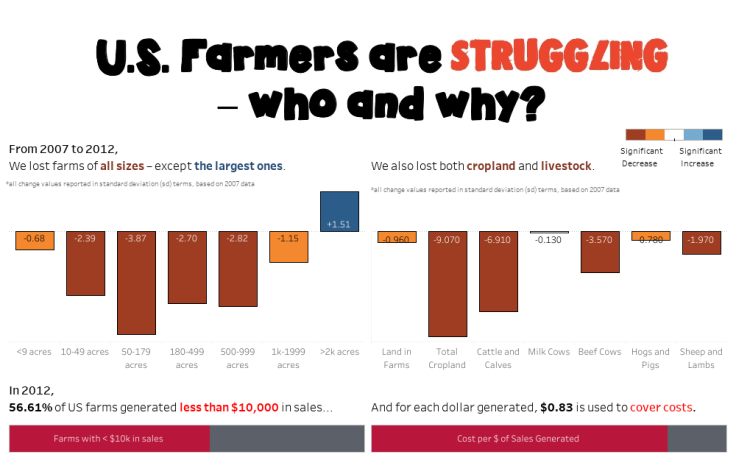
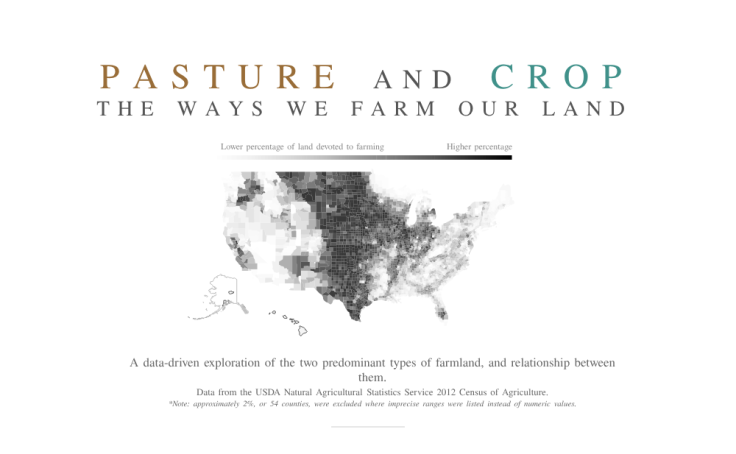
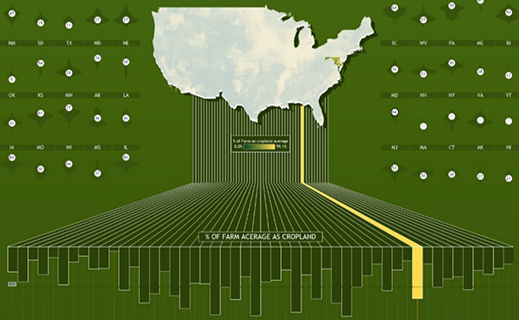
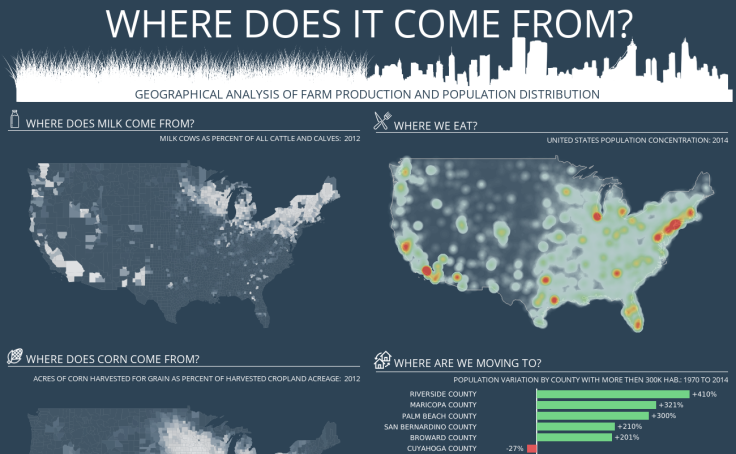
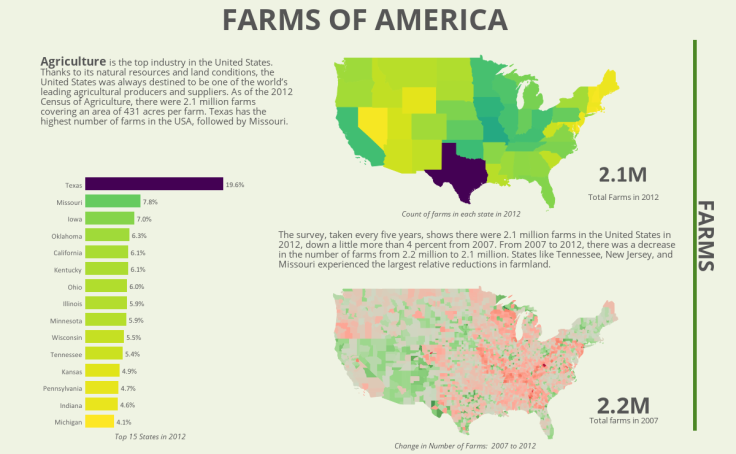
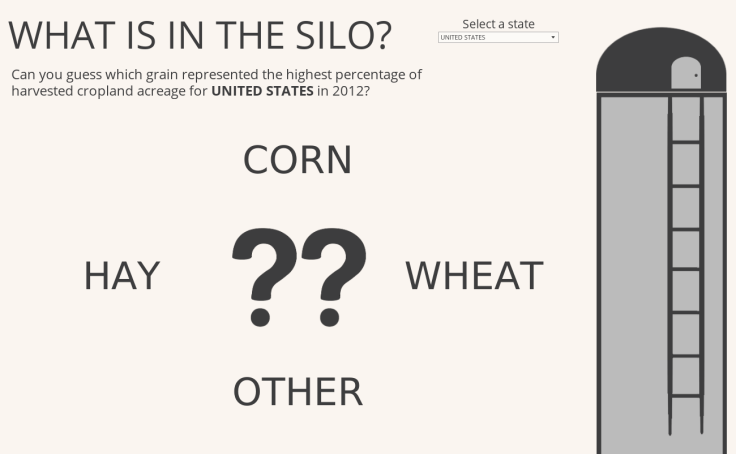
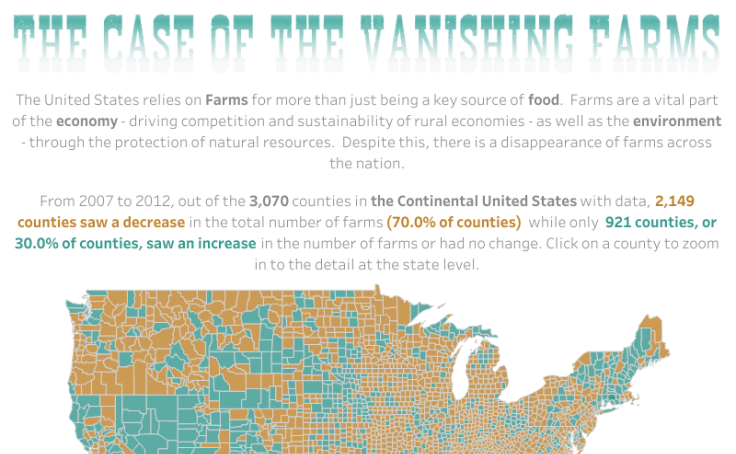
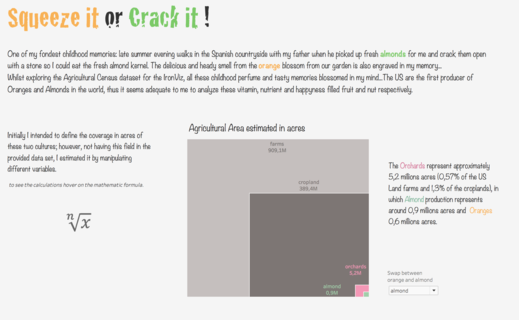
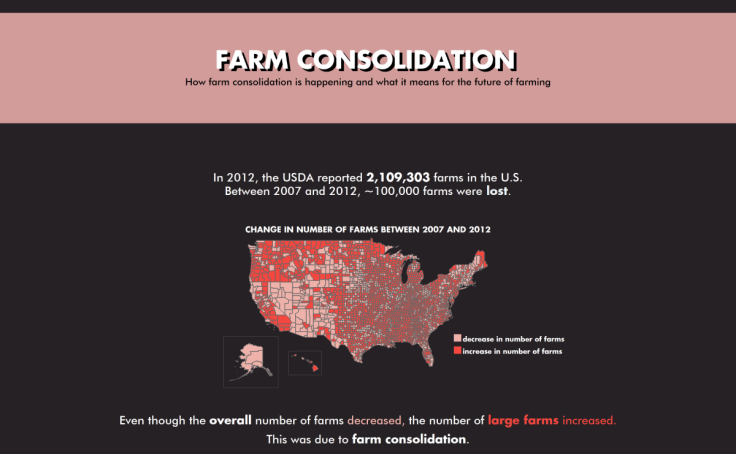
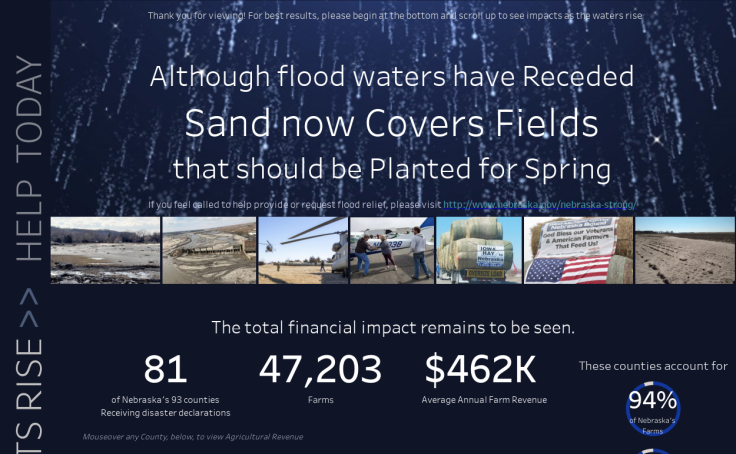
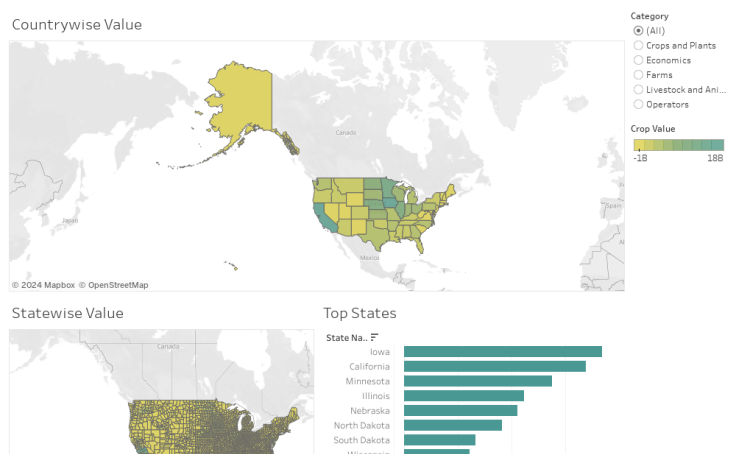
The entries are in for the first 2019 Iron Viz global qualifier contest that determines who advances to compete live at Tableau Conference in Las Vegas this Fall! We challenged you to create vizzes using only the provided data from the U.S. Department of Agriculture. We received 75 radishing entries— that’s a 25% increase compared to last year! Check out all the entries in the gallery below.
Over the next few days, our judges will review the submissions and score them according to three criteria:
- Design: How appropriate is the design for the story that is being told?
- Storytelling: Is there a clear story being told or question being explored, and is there appropriate context?
- Analysis: How sophisticated and appropriate is the data that is being used for the story?
Our judges will determine the winning viz and the author will advance to compete live on the Iron Viz stage at this year’s Tableau Conference (#data19) in Las Vegas.
While only one will advance to the championship, all 75 participants should be extremely proud. This was not an easy data set, but the encouragement, teaching, and inspiration we saw from the community was astounding and represents exactly what makes our community so unique. Remember, win or learn—you can’t lose. Impressed by the submissions? Be sure to favorite them and follow each authors’ Tableau Public profile.


Dig these vizzes? Follow the authors on Tableau Public and give them a shoutout on social media with #IronViz!
相關文章

Meet Iron Viz 2024 Finalist Jessica Moon
 2024/04/15

Meet Iron Viz 2024 Finalist Pata Gogová
2024/04/08

Student to BI Analyst, How Tableau Can Lead to a Successful Data Career
 2024/03/20
Subscribe to our blog
在收件匣中收到最新的 Tableau 消息。