4 Steps for Finance Departments to Drive Business Intelligence
Learn how modern finance departments are saving time and delivering insights to the business with visual analytics
Download this free whitepaper
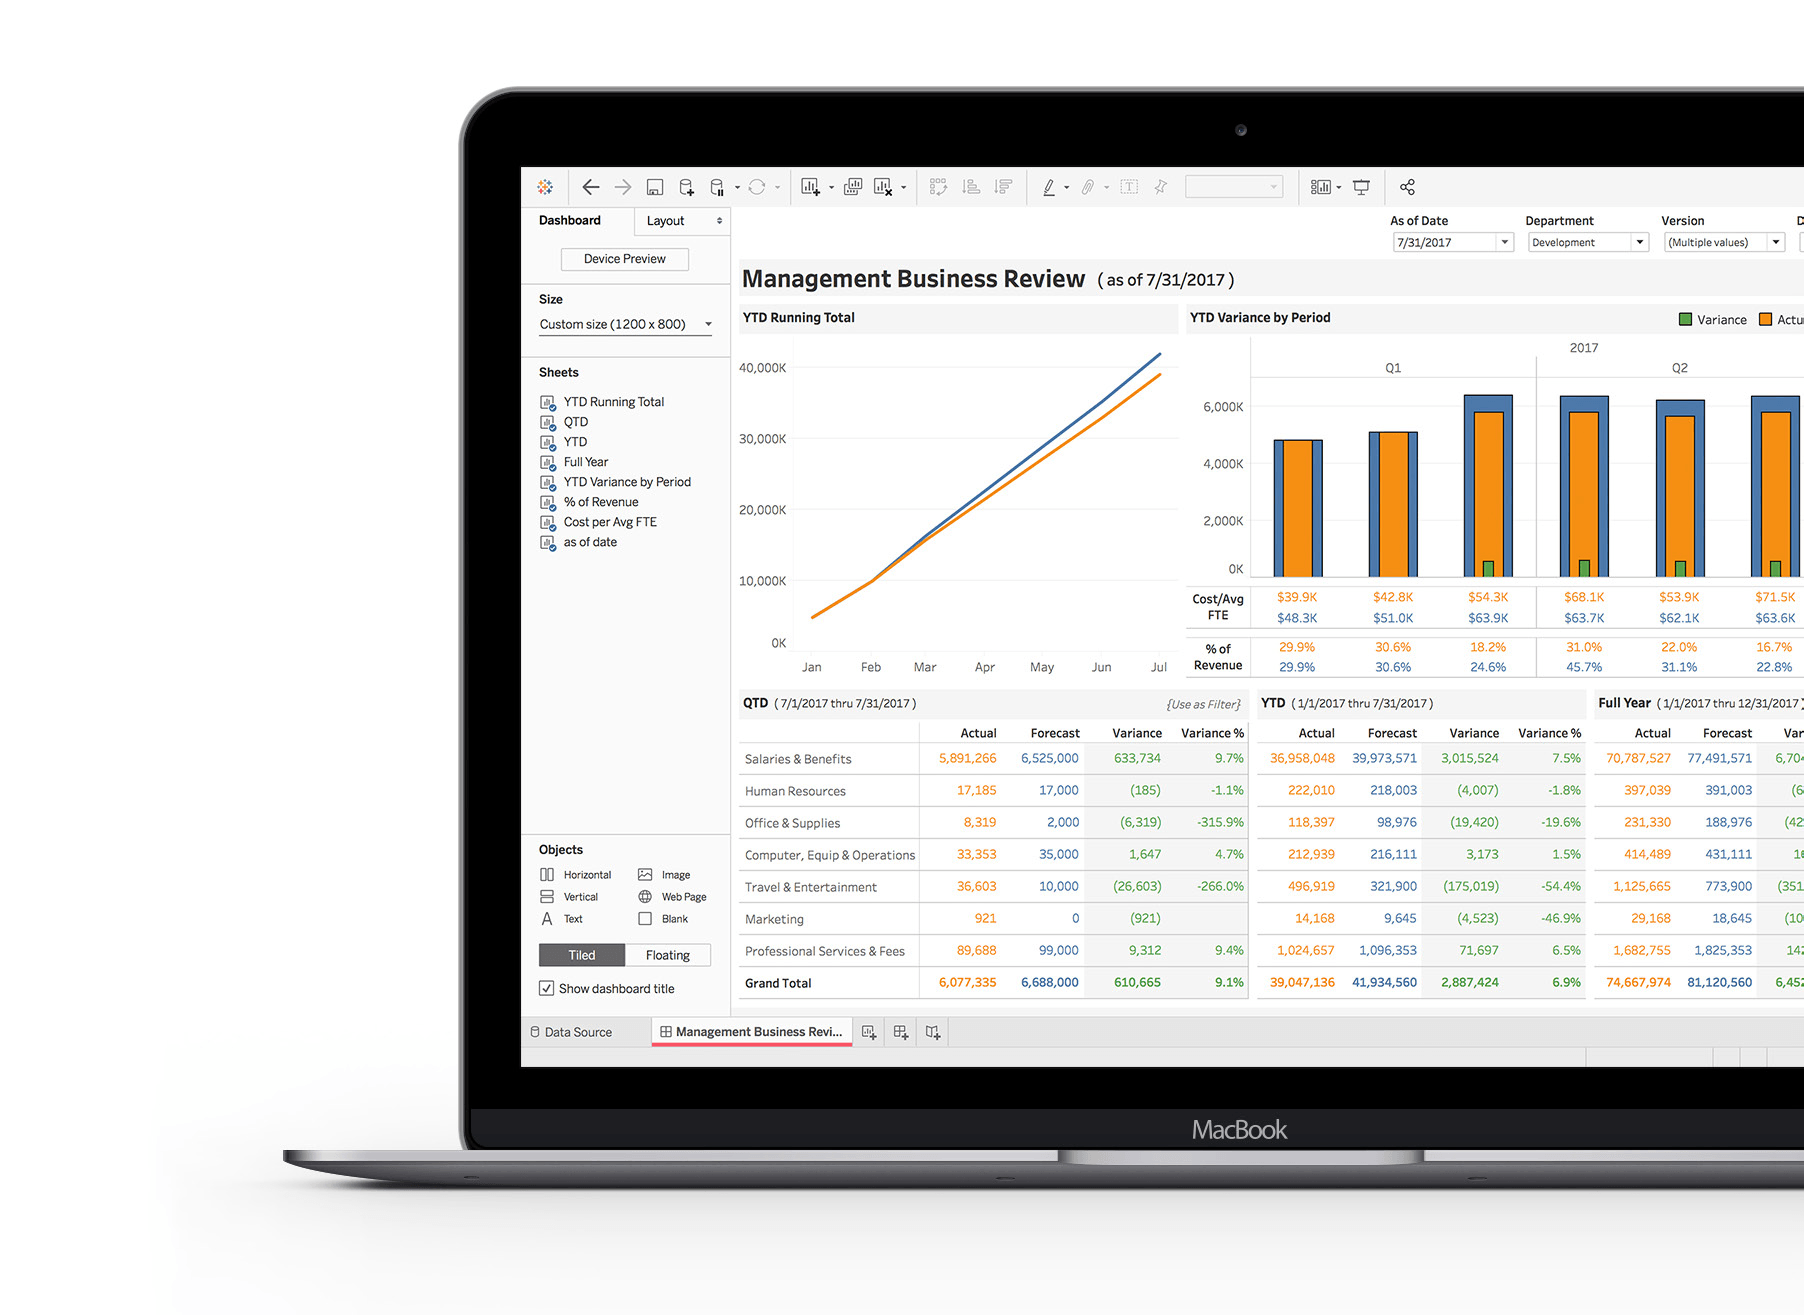
Every day millions of finance professionals extract data from various source systems and often manually engineering reports with spreadsheets to find the answers they seek. As great as spreadsheets can be, the limitations of these tools and processes are time and accuracy. By relying solely on spreadsheets for recurring financial reporting, the Office of Finance loses precious time that could be spent on in-depth analysis, forecasting, and serving as a strategic partner to the business. The solution is to set up self-service analytics with finance dashboards, using managed and current data sources, that serve as single sources of truth to your stakeholders. These finance dashboards permit greater agility when ad hoc requests appear.
Read this whitepaper to learn how modern finance departments are saving time and driving business intelligence by adding powerful data analytics to their processes and technology stacks. In this paper, you’ll learn about four steps to improve financial analysis for significant time savings:
- Unifying and using all of your data
- Scaling and repeating analysis faster
- Revealing more insights with interactive analysis
- Improve organizational insights into data
We wanted our solution to be accessible and effective for everyone in the organization, not just analysts.