What to know about data on police violence


News of the murders of George Floyd, Breonna Taylor, Manuel Ellis, and too many more has reopened past wounds of policing and violence against the Black community in the United States. It is a reminder, yet again, of the injustices Black Americans face, often at the hands of police agencies tasked with protecting communities.
Across Tableau and the Tableau Community, there is a search for data that can help inform understanding of and solutions to racism and race-based violence. Data is not an answer in and of itself, but it can be an inroad into seeing the situation more clearly. We know that many in our community and #datafam are outraged at these most recent injustices, and want to contribute support to the cause of ending systemic racism and violence against Black people.
Many in our broader Tableau community have already delved into the data on police violence against Black people and people of color in the United States. For those that want to contribute to the conversation or educate yourself further, we’ve compiled several resources below on the complexities of the data and the context surrounding it. These resources come from people who have been dedicated to the effort of using data to call for reforms for years. We hope that by compiling them here, we can connect the Tableau community directly with their knowledge and expertise.
Here is what to know:
Get familiar with and amplify the efforts of Black data scientists and advocates
Police violence and systemic racism in the U.S. can’t be understood through data alone. Beyond looking to datasets and statistics, look to the people, data scientists, and organizations in the Black community who have been working against these issues for years. To name just a few: MappingPoliceViolence.org, Data for Black Lives, Center for Policing Equity, PolicyLink, Color of Change. Learning directly from these organizations and the people in them is absolutely critical to understanding what the numbers are showing around police violence against Black people and how to put an end to it. For any work you do in this area, consider how your data practice and your platforms could amplify these ongoing efforts.
Understand why data on police activity is so complex
Data reported from police departments is often inconsistent or spotty. Efforts have been introduced at the federal and state level to mandate better data collection and reporting around everything from use of force in encounters to the demographics of the victims, but compliance is inconsistent. Furthermore, according to reporting by Reuters, the majority of police union contracts in large cities require disciplinary records to be scrubbed after a certain amount of time, so it’s often difficult to access data on events or individual actions by officers.
Here are more resources to understand the complexity of the data:
- The New York Times: Data on Use of Force by Police Across U.S. Proves Almost Useless
- Buzzfeed News: There’s One Big Reason Why Police Brutality Is So Common In The US. And That’s The Police Unions.
- CheckThePolice.org: Overview of police union contracts and barriers to accurate data reporting
- The Atlantic: How to Actually Fix America’s Police
Look to crowdsourced data streams that make up this information shortfall
Because the data accessible at the federal level is incomplete, several independent organizations have built out their own databases to track police killings and use of force. This is commonly done by a nationwide network of volunteers compiling details from local new reports on individual incidents. These databases are linked below, and you can download the data directly from the sites. Note, though, that the databases all have different methodologies for collecting and determining which data to include, which means there will be variances in what is shown. And the databases also often do not include data on the use of nondeadly force, so they’re not a complete picture of the scope of police violence.
Understand where to access data on police departments
Everything from police headcount to budget to what policies are actually contained in police union contracts are also incredibly important data for understanding police violence. This information is often not readily available to the public from police departments themselves, but several organizations are compiling it. For a good overview of the size of police departments per capita in a number of U.S. cities, Governing.com has compiled this publicly accessible database.
For more granular data on police department activities and contracts, the advocacy organization Campaign Zero is running two connected efforts to collect and share that information. Through Police Scorecard, Campaign collects and shares data on specific police departments, including total arrests, arrests by offense type, unsolved homicides by race, and budget. The platform currently spans departments in California, but will evolve to contain more data on departments across the U.S. Through Check the Police, Campaign Zero has compiled the contents of the police union contracts of 81 of America's 100 largest cities and the police bill of rights in all 15 states to show the policies make it more difficult to hold police accountable.
Know where to access data on community demographics
It’s helpful to understand all the data on police-connected violence and police departments overall in the context of the communities in which they operate. Demographic data is vital for being able to see, for instance, where Black communities or communities of color are disproportionately policed, and what other systemic barriers these communities face. This data at a national level is available from a number of sources below, and many regional entities also produce their own reports and datasets:
Consider data on factors surrounding police violence
Beyond the data above, there are numerous indicators that correlate with rates of police-related killings. Looking to data on issues beyond police killings and use of force can expand the understanding of these specific issues, as well as the broader landscape of systemic racism.
Here are some examples of how that can be done:
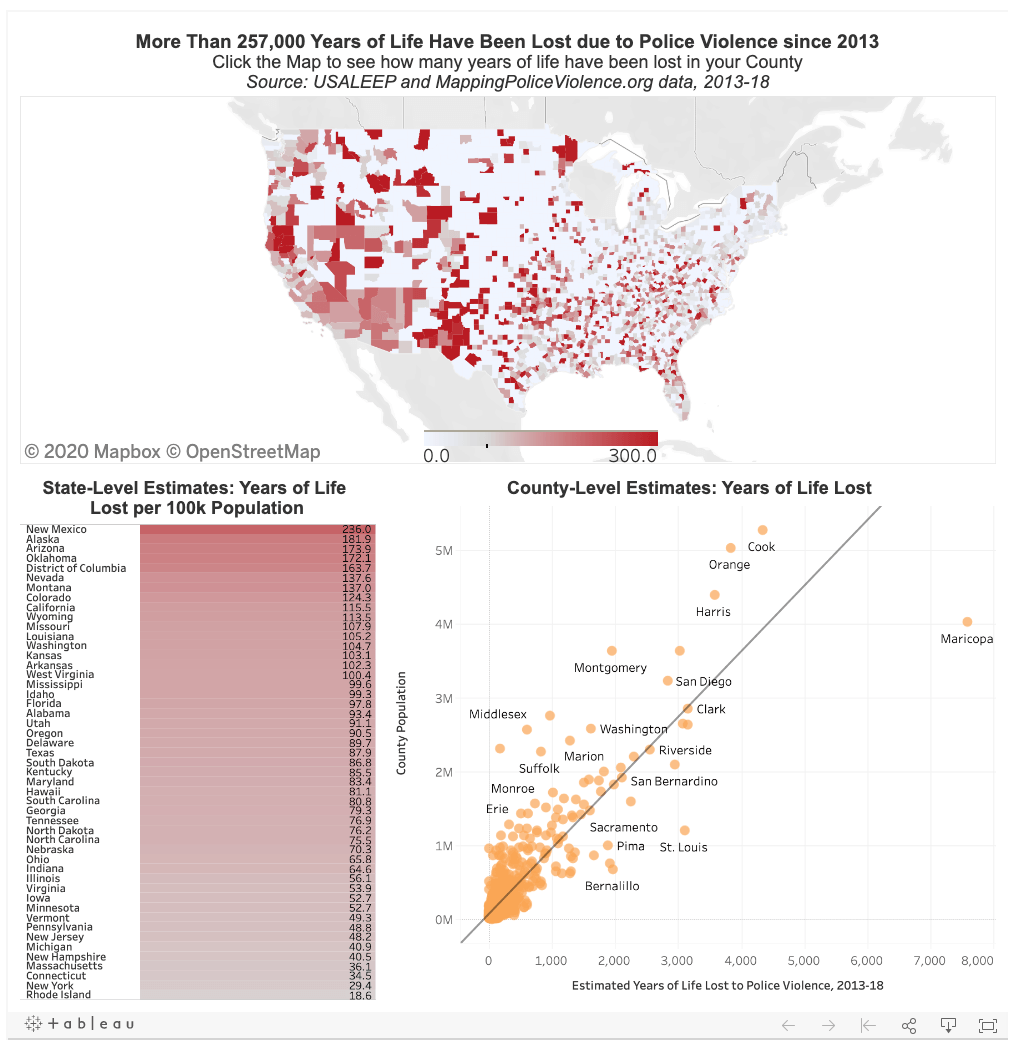
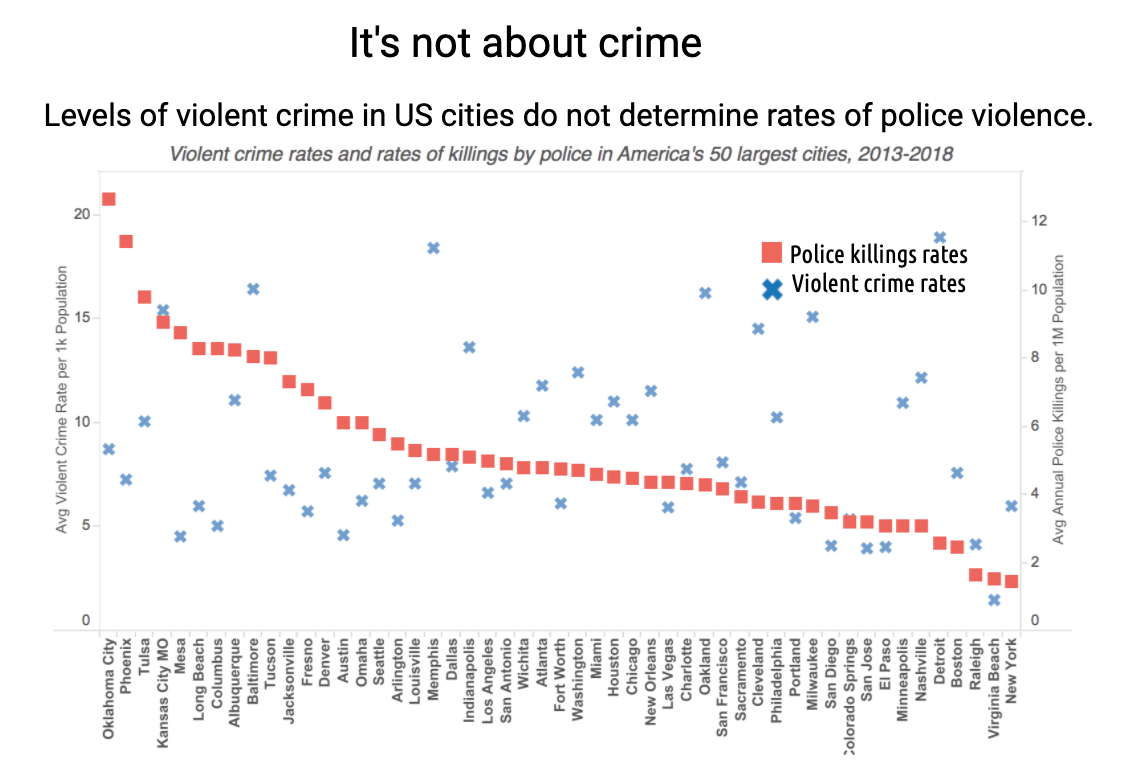
- Mapping Police Violence makes the point that local crime rates do not correlate with police violence rates
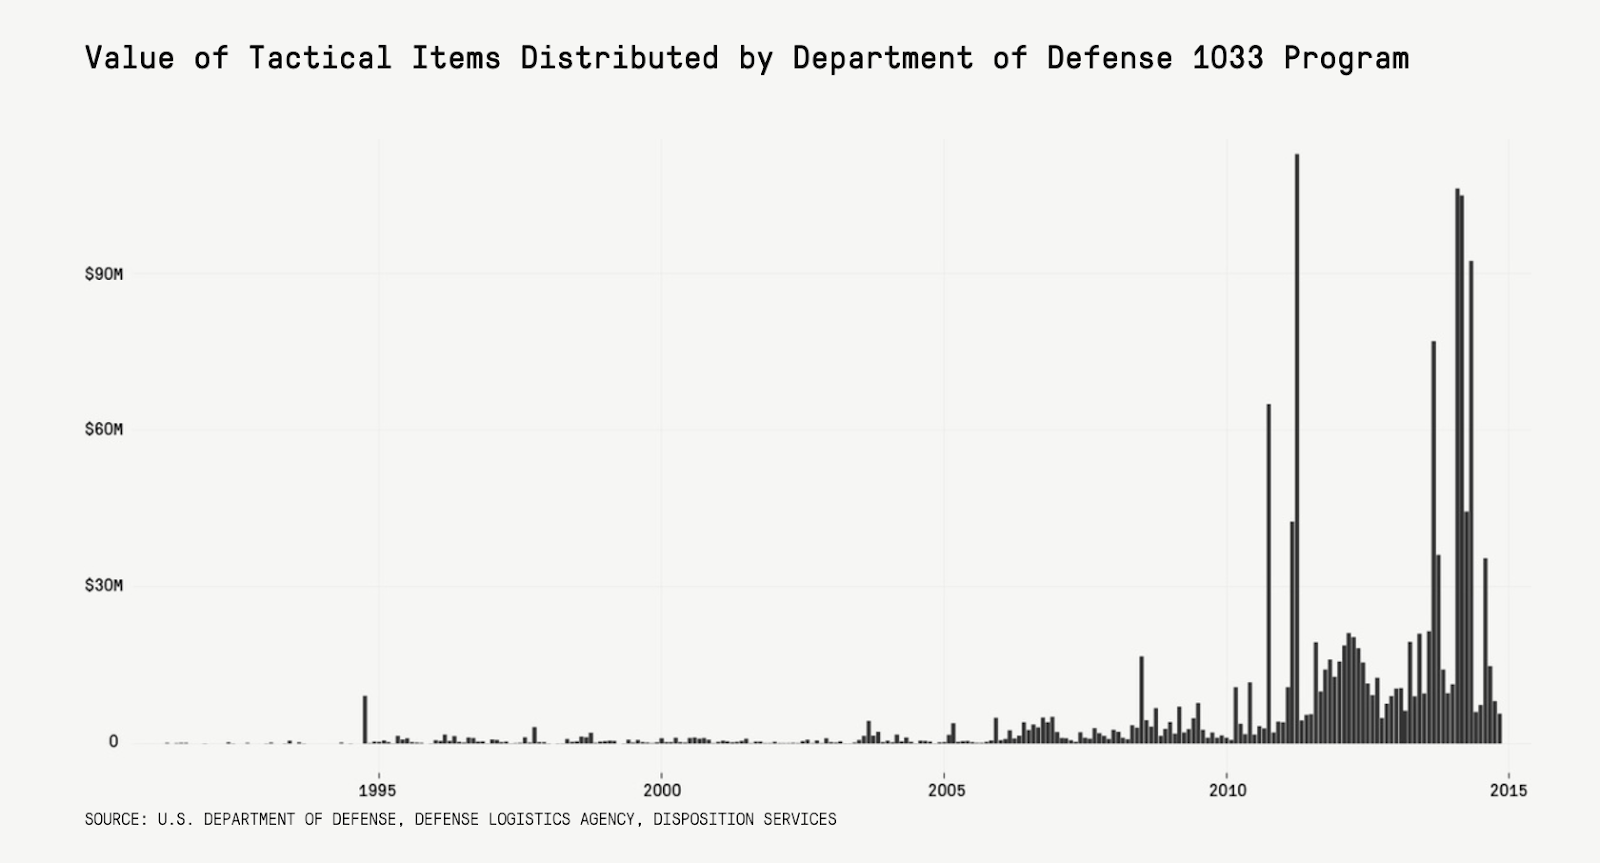
- The Marshall Project does an investigation into the value of tactical items distributed by the Department of Defense to local law enforcement agencies
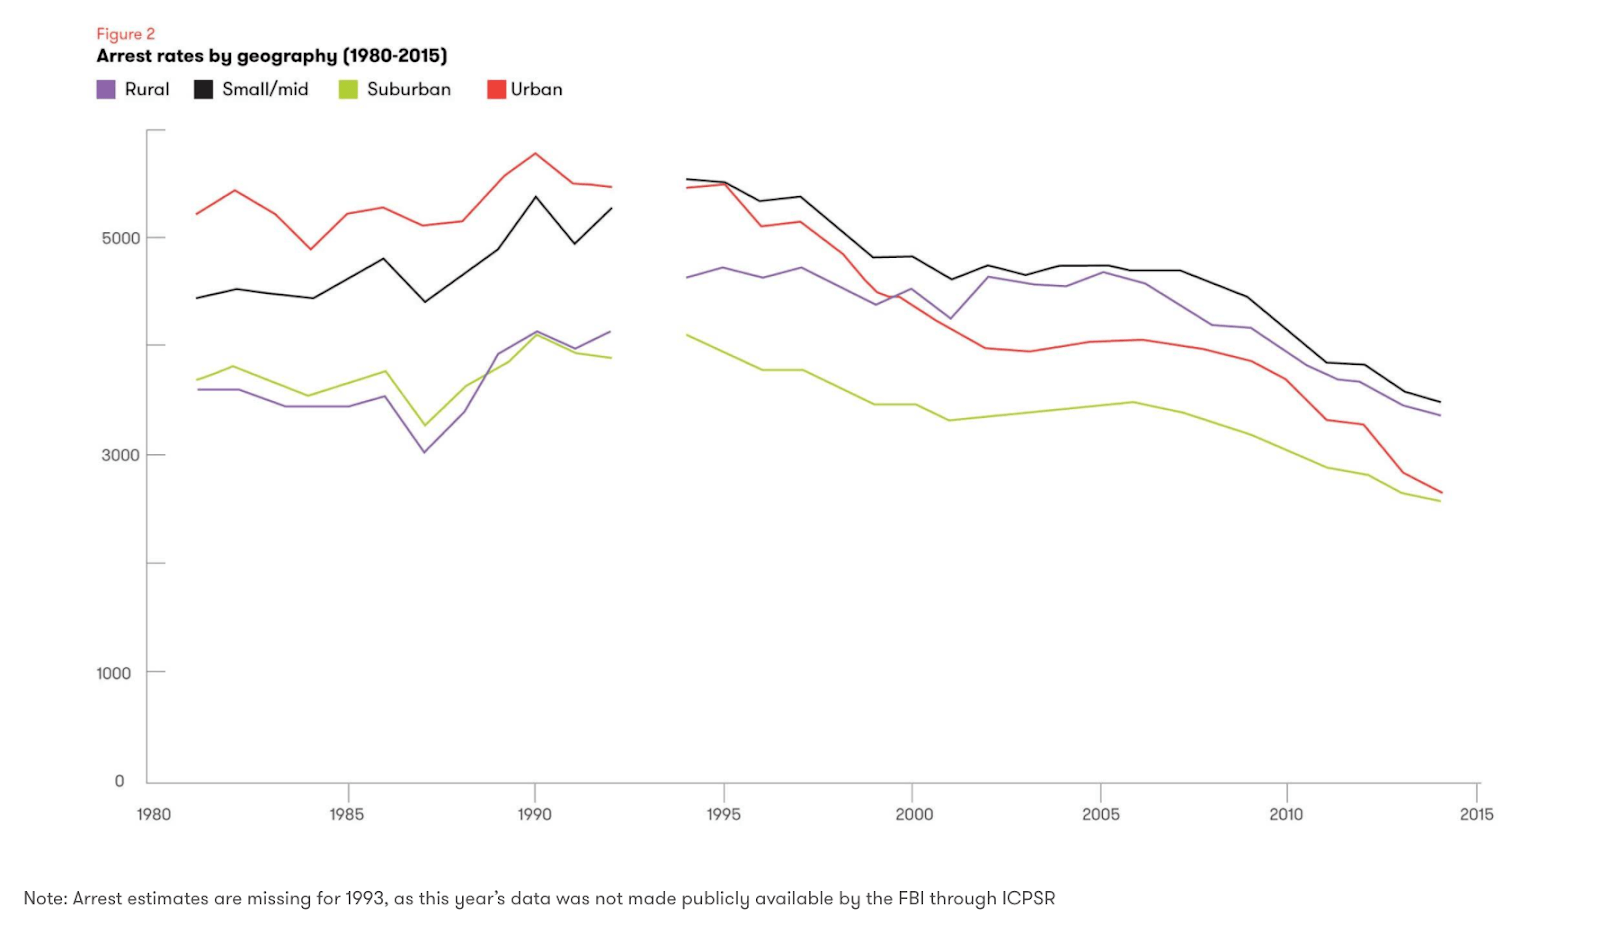
- The Vera Institute of Justice has visualized arrest rates over time, which could relate to police violence data, as use of force and killing are more likely to occur when an arrest is underway.
These are just a handful of examples, but they’re designed to show that data on police violence is not limited to the data on killings included in the databases above. The context—everything from data on reforms and policies enacted, to local demographics, to race and ethnic makeup of police forces, to local incarceration rates—tells an important story of the background against which these killings are happening.
At Tableau, we believe that data is a tool for better understanding and solving even the most complex and entrenched issues. The complexity of data on police-connected killings is a reminder that accurate data is not a given—it can be hard to come by, and can require significant effort to compile. We hope you use these resources above to inform yourself about this particularly complex data landscape, and the people and organizations who are working to make this data—and the issues it reflects—more visible.
相關文章

How Team USA uses data to build a digital HQ
 2022/02/08


Healthcare Analytics Hub Starter Kit: Get the data you need faster
 2019/10/18
The purpose of the Healthcare Analytics Hub Starter Kit is to provide a sample of what your healthcare app could look like. It’s not a complete solution; instead, it’s focused on what’s possible. Please contact your Tableau Account Manager to get started today!
Subscribe to our blog
在收件匣中收到最新的 Tableau 消息。