Understanding how Tableau calculation types work together


Tableau calculations can be challenging
If you are struggling to understand how to use Calculations in Tableau, you are not alone. It’s one of the most challenging aspects of Tableau to explain to my MBA or MSc students, and it took me a few years to be comfortable using them, myself.
After trying many different approaches, I would like to share with you my methodology for understanding how to combine the different calculation types.
The main challenge is thinking in terms of flow, rather than cell positions, as you may do when using Excel. Tableau is very powerful with the ability to trigger multiple queries to process a single calculation. So the key is to understand in which order those calculations—those queries—are processed.
First, I will quickly define the four calculation levels, and then I will explain how you can combine them.
The four main calculation types
Row-level calculations
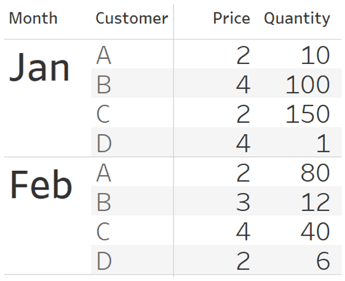
Row-level calculations are calculated for each data set row. Let’s consider the data set below:
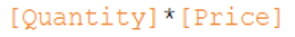
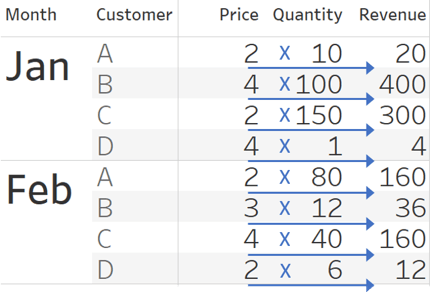
Now let’s add the following calculation to compute the revenue:
We’re asking Tableau to add a column—a field—that is going to be calculated by using other fields from the same row. In Excel, it would be like adding a column for a calculation that is computed horizontally, as you can see with the below blue arrows:
Aggregation calculations
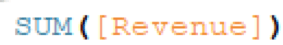
To visualize your data at the correct level of detail, Tableau has to aggregate the data. The Level of Detail of your visualization (VizLOD) is the level represented by the marks on your Tableau canvas, defined by the dimensions that you are using to visualize your data. So if your marks are bars that represent months, then the level of detail at which Tableau has to aggregate the data is the month. Using our previous example, if we want to visualize Revenue at the month level, we can add this calculation:
This means that Tableau is going to use four rows from our data set to draw each bar. In Excel, it would be like summing a column—doing a vertical calculation as you can see with the blue arrows below:
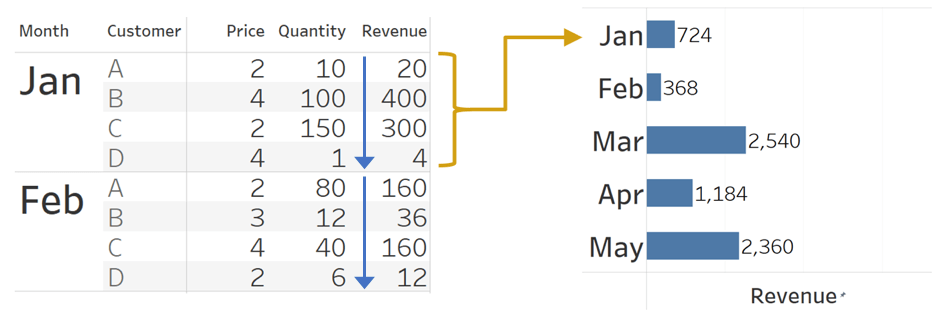
Table Calculations
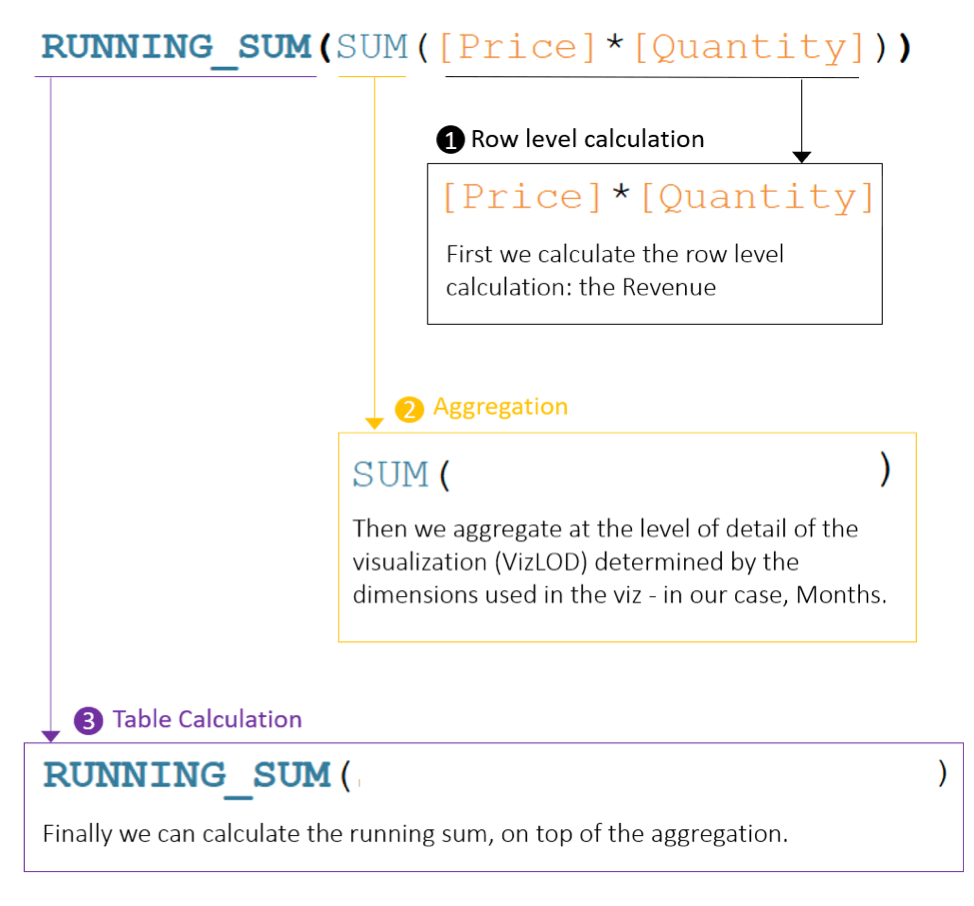
Table Calculations are calculated after the aggregation. You may use a Table Calculation to aggregate further, like to a running sum, or you may want to compare the aggregated values by computing a rank. Let's say that we would like the Revenue running sum. Our formula will be:

To process this calculation, Tableau will compute it in three steps:
- First the record level calculation: [Revenue]
- Then the aggregation calculation: Sum([Revenue])
- And the table Calculation: Running_SUM(SUM([Revenue]))
It could be illustrated as follows:
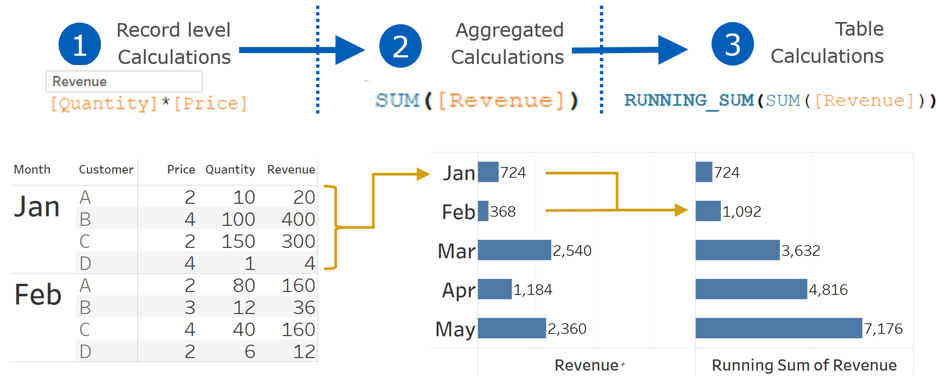
An important thing to keep in mind when using Table Calculations is that each mark can only use aggregated values that are present on your visualizations. So to get the running sum for May (which is 7,176) we have to have Jan, Feb, Mar, Apr and May in our visualization.
Level of Detail expressions
Level of Detail (LOD) expressions are needed when an aggregation calculation (SUM, MIN, MAX, AVG, etc.) has to be computed at a different level of detail than the Viz level of aggregation (VizLOD). If we use the LOD expression diagram made by Meredith Dicks and Alan Eldridge and we add on top of it our four calculation types, we get this diagram:
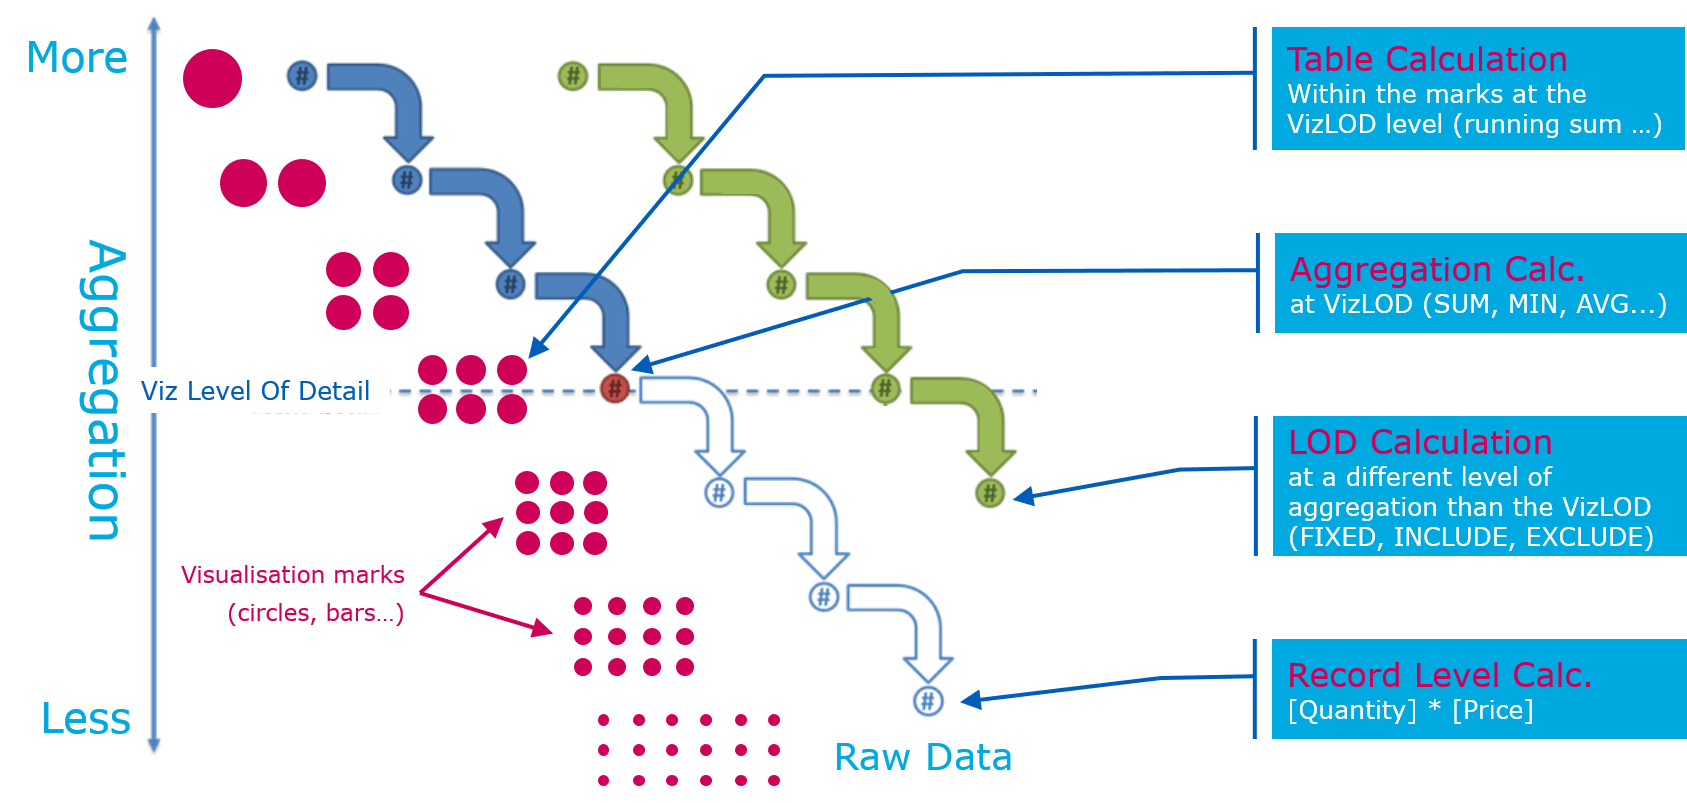
So we saw that the different calculation types are computed in a certain order, and now we can see that they are also computed at a different level of detail.
A few examples for more practice
Often students at schools, colleges, or at work come to me asking “Why is my calculation not getting the result that I expect?”
To help them, I proceed as follows:
- First, we need to understand what each row of the data source represents—Jonathan Drummy would call it the “data grain.” You need to have this in mind to build your calculations, especially when doing an Aggregation calculation. For example, if we use the “World Indicator” dataset that you get when installing Tableau, we see this calculation:
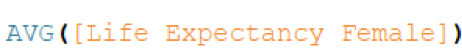
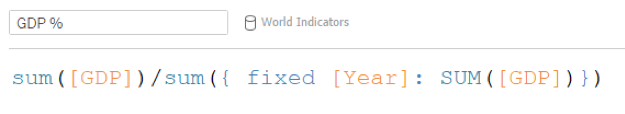
To understand the result, we have to know what each row of the World Indicator dataset represents. Knowing that a row is for a country/year, we understand that this calculation will return the country/year average Life Expectancy. - Then the second thing that we need to understand is in which order each part of the calculation will be computed—what I would call the calculation flow. Let's again refer to the “World Indicator” dataset. My goal is to calculate the global percentage of GDP by country. Because I do not want to display all the countries on my visualization, I will not be able to use a Table Calculation (remember that the Table Calc relies on figures that are present on your Tableau canvas, in each mark). So to get the yearly GDP, I will use a LOD expression:
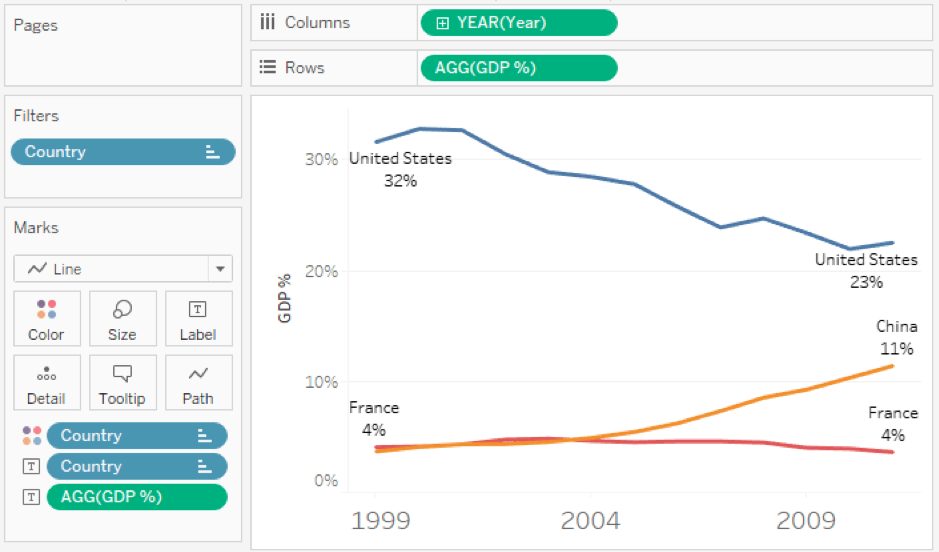
This is the calculation results we get for three countries:
If we break down this calculation, this is what we get:
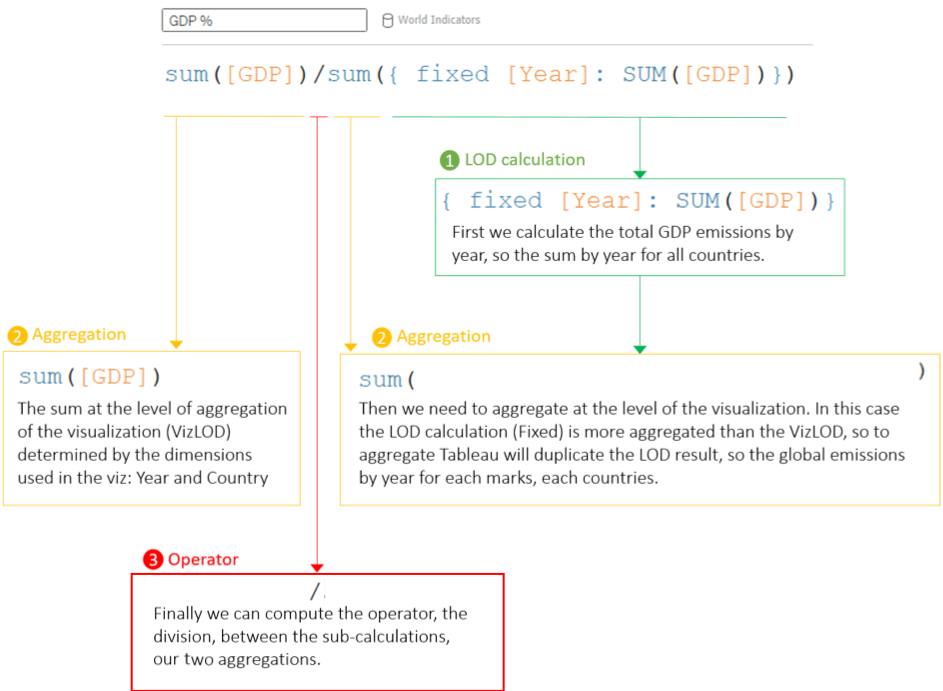
So with our original example, this is what we get:
What should you keep in mind to master your calculations
- Always start by understanding what each row of your data source represents—the data grain.
- Remember in which order calculations are computed:
- Row-level calculations & LOD calculations
- Aggregations
- Table Calculations
- When trying to understand a calculation made by someone else, always start by breaking it down by calculation types. To categorize by calculation types, this list with the most common calculations should help you:
- Aggregation: SUM, AVD, MIN, MAX, MEDIAN, ATTR, etc.
- LOD: FIXED, EXCLUDE, INCLUDE
- Table calculations: RUNNING_ , RANK_ , WINDOW_ ,INDEX, FIRST, LAST, LOOKUP, etc.
- Row-level calculations: most of the rest
- Tableau has to aggregate your calculation at the VizLOD, so if you did not add an aggregation operator, Tableau will automatically wrap your calculation with a default aggregation operator like SUM() or AVG(). If only one part of your calculation has aggregation operators, you will get the most famous Tableau error: “Cannot mix aggregate and non-aggregate arguments.” To solve this, aggregate all your sub-calculations.
I hope this will help you understand most calculations and harness the power in Tableau that allows us to generate queries at different levels of aggregations and multiple operations—one after the other, with a single calculation!
Yvan Fornes is a French Tableau Public author, current Tableau Zen Master and Business Intelligence Expert at Amadeus. Find more of Yvan’s tips, tricks, and vizzes on his Tableau Public page and be sure to connect with him on Twitter @YvanFornes.
相關文章

How Team USA uses data to build a digital HQ
 2022/02/08


Healthcare Analytics Hub Starter Kit: Get the data you need faster
 2019/10/18
The purpose of the Healthcare Analytics Hub Starter Kit is to provide a sample of what your healthcare app could look like. It’s not a complete solution; instead, it’s focused on what’s possible. Please contact your Tableau Account Manager to get started today!
Subscribe to our blog
在收件匣中收到最新的 Tableau 消息。