Escaping traditional BI: a starter guide for IT


This guest blog is written by Bridget Cogley, Tableau Zen Master and consultant at Teknion Data Solutions. After helping pick Tableau in 2010, she’s not looked back and helps others realize the potential of Tableau. You can find more of her writings at tableaufit.com.
In The Phoenix Project, the fictional narrator Bill Palmer talks about how IT is “the lifeblood of the organization.” Invisible but present throughout the organization, a bad day in IT can mean other people are wholly unable to do their jobs. For years, this meant IT owned business intelligence. It also created a situation where no one fully walked away from the table satisfied.
The first time I helped a company select Tableau, we locked our IT department in the trunk of a car and took them—screaming—for a bumpy ride. On the spectrum of how decisions in organizations are made, we lived teetering on the far edge of the extreme. We were a rarity in 2010, yet perhaps a klaxon for what was to come. By 2015, Gartner revised their Magic Quadrant to take into account how more business users not only wanted in on this decision, but also expected to drive it.
As a consultant, I’ve seen the gamut of creative ways business analysts got to the information, from spreadmarts to local databases, and even servers quietly humming at their feet—or should I call it a heater, like they did? Humans are intrinsically creative. Presented an obstacle, humans are designed to find a way around it, no matter how circuitous the path. For IT, this presents a struggle: How can the data be protected, validated, and certified when it exists out of view? Enter modern BI.
A team approach
Modern BI requires more than treating the business like a customer, but full-on teaming and trust. Trust is scary and IT often has to consider what can go wrong for things like security and resource management. Business users are demanding far more control, expecting to be able to perform ad-hoc analyses online and bringing in open data like census information, housing stats, and weather trends.
IT departments have their hands full, handling the gamut of security, access, connectivity, software deployment and support, and balancing the growing needs for more data. Deploying this data is a challenge—more people want greater access and the ability to understand the business in novel ways. Traditional BI kept much of the information locked down, creating more work for both IT and business. It also helped create animosity, as no one could succeed.
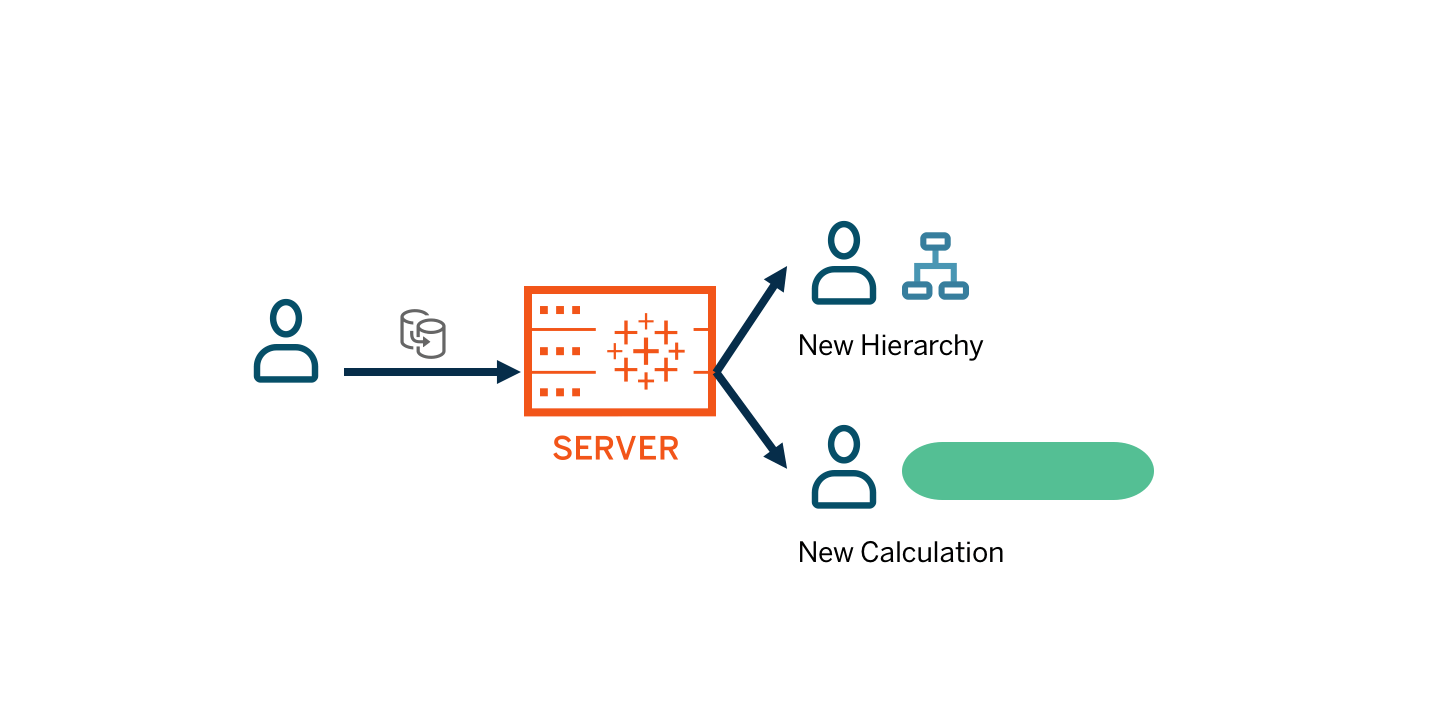
Tableau operates differently, allowing IT to focus where it excels, like managing server resources, setting preliminary access, and supporting processes that are repeatable. Tableau Server allows IT to let business users balance control with support. Take for example data sources, which can be a massive source of ongoing debates. IT can publish and certify sources, while business users can still add non-certified calculations and other non-certified sources. This gives analysts the speed they desire and need while allowing IT a path to govern.
Giving business users ownership of dashboards and performance measures lets them work with internal analysts to create more effective dashboards. Custom administrative views from the data stored in Tableau’s Repository can provide resource usage analysis to help analysts get an idea how their dashboards are engaged with and which might need optimizing. This database collects all actions on server, which can be useful for performance, usage, and creating custom home pages.
Communication and control
Stability is key in any implementation. Tableau, by nature, has a bit of a bursty nature—extracts, user activity, and subscriptions all factor into performance. A poorly designed viz or data source can wreak havoc for users. Creating stability is key. On the business side, users operate by habit. They may all login at 8 AM, go to their favorite dashboards or set 900 alerts, which can put massive demands on server.
Communication is key. Often, factors outside of IT's control come into play. A specific vendor may only upload the data at 8 AM, which means waiting to refresh the extract. Communicating expectations to users and designers can make or break an implementation.
Traditional BI tells us to seek the utmost amount of control, creating a default answer of “no.” Tableau encourages the opposite, clamping down only when needed. For example, you can tightly control HR data, while opening up financial data a bit, and allowing increased access to general business data.
So how do you set yourself up for success?
- Create an implementation and maintenance team that includes both business and IT. Establish a clear vision for what your analytics will achieve and the roles involved to get you there together.
- Empower your business users as much as possible. Who could benefit from web authoring? What business user could own a project? Remember, you can create projects and sites with varied levels of control.
- Use “and” in discussions. Can you change an “or” problem to an “and” one? For example, we want limited access to HR data and we want people to have access to their stats. Does it make sense to create different sources and roles?
- Start small. So often we get a new product and roll it out to the masses. Your institution has its own culture, concerns, and needs. Pick a few testing grounds to learn.
- Report and review. Tableau offers access to their Postgres tables. If there was ever an underutilized feature, it's this. Make some sources, create your own analyses, and open it up to your business users. Allow people to mash this data against Salesforce and other data sources to answer those really tricky questions, such as whether these dashboards are helping sales. Review at least every six months to make sure people are happy. You might be able to delegating a few more things to hungry business users.
- Focus on team play and avoid putting anyone in the trunk. Just like a good road trip, people should take turns driving, particularly in their areas of expertise.
Some common threads through these suggestions are collaboration and iteration. You’ll succeed with clear goals, communication, and understanding what’s effective as you navigate modern BI in your organization.
This post is part of a series where Tableau Community members share their experiences moving from traditional to modern BI. Read more of their thoughts and lessons learned about a framework for governance, consolidating trust with Tableau Data Server, deploying modern BI in a traditional environment, and scaling Tableau in the enterprise.
相關文章

Embedded Analytics: Should you build or buy?
 2022/06/07

IT’s role in building a Data Culture: Analytics agility, proficiency, and community
 2021/12/06
Three ways to help everyone make fast, data-driven decisions with modern BI
2021/11/22
Subscribe to our blog
在收件匣中收到最新的 Tableau 消息。