How to use MongoDB's Connector for BI 2.0 with Tableau


Last week, we had the pleasure of co-presenting a webinar with our partner MongoDB. Buzz Moschetti, Enterprise Architect at MongoDB, rolled out the updated MongoDB Connector for BI. In addition to explaining how the connector works, Buzz created on-the-fly visualizations of a sample data set in Tableau.
When you pair Tableau’s ease of use, MongoDB’s flexibility, and the connector’s agility, your time to analytics gets a whole lot shorter. Here are the highlights from the session.
What is the Connector for BI?
To answer that question, let's look at the ways MongoDB natively manipulates data.
The highly-expressive MongoDB Query Language (MQL) and the many operators in its Aggregation Framework are powerful tools to process and transform data within MongoDB. MongoDB has made many improvements to MQL over the years, and, with each release, introduces new operators and different ways to manipulate the contents of your collections. While MQL has slowly incorporated much of the functionality of SQL, the Aggregation Framework will always use the pipeline/stage approach rather than the more grammatical style of SQL.
 > db.foo.insert({_id:1, "poly": [ [0,0], [2,12], [4,0], [2,5], [0,0] ] });
> db.foo.insert({_id:2, "poly": [ [2,2], [5,8],  [6,0], [3,1], [2,2] ] });

> db.foo.aggregate([
 {$project: {"conv": {$map: { input: "$poly", as: "z", in: {
                	x: {$arrayElemAt: ["$$z”,0]},  y: {$arrayElemAt: ["$$z”,1]}
                	,len: {$literal: 0}  }}}}}
,{$addFields: {first: {$arrayElemAt: [ "$conv", 0 ]} }}
,{$project: {"qqq":
	{$reduce: { input: "$conv",  initialValue: "$first",  in: {
            	x: "$$this.x”, y: "$$this.y"
            	,len: {$add: ["$$value.len",  // len = oldlen + newLen
  {$sqrt: {$add: [
                      	{$pow:[ {$subtract:["$$value.x","$$this.x"]}, 2]}
                      	,{$pow:[ {$subtract:["$$value.y","$$this.y"]}, 2]}
                     	] }} ] } }}
,{$project: {"len": "$qqq.len"}}

{ "_id" : 1, “len" : 35.10137973546188 }
{ "_id" : 2, "len" : 19.346952903339393 }
An example of an MQL aggregation pipeline to calculate the perimeter of simple polygons. Note that the polygons themselves are well-modeled as an array of points—each point itself being a two-item array.
The native functions of MongoDB are an excellent match for the document data model and processing-nested arrays within documents are uniquely suited for the pipeline methodology.
However, the fact remains that MongoDB does not speak SQL.
MongoDB created the Connector for BI because of the robust ecosystem of SQL-based tools that empower everyone within an organization to get to data-driven insights faster.
Enter: the Connector for BI 2.0.
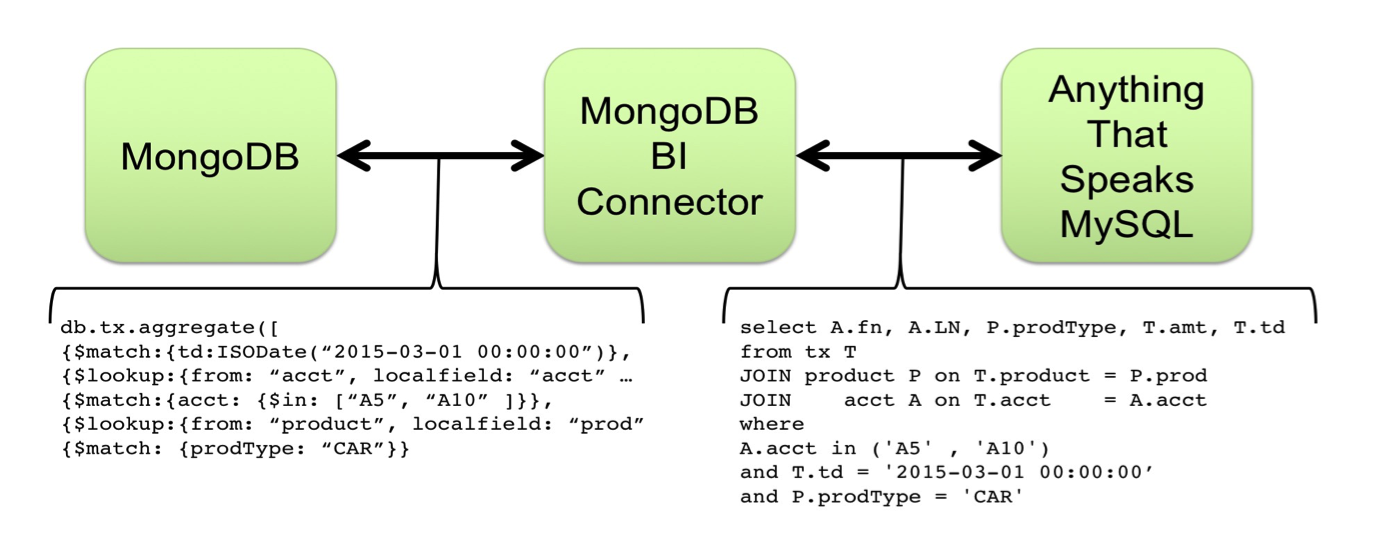
The connector is a separate process that takes a MongoDB database and maps the document schema into a relational structure that is then held in MySQL.
One of the most powerful characteristics of the connector is that it is not bulk ETL processing. The Connector for BI provides a read-on-demand bridge between your MongoDB collections and your SQL-based tools.
How does the Connector for BI work?
Built for the enterprise, the Connector for BI was designed with security and access control in mind. The Connector for BI accesses data stored in your MongoDB database using the same authentication and entitlements you created to secure your data. Fundamentally, that means you cannot process data through the connector that would be otherwise inaccessible from MongoDB directly.
Not only does this keep your data secure, it reduces the need for a separate set of credentials for your InfoSec team to manage.
Along with the connector, MongoDB provides a utility called “mongodrdl” which examines a source MongoDB database and quickly constructs a default set of mappings between the structures it finds in MongoDB and the tables and columns appropriate to project in a relational schema. This utility is governed by the same security and access protocols as the connector itself.
Using Tableau with MongoDB
MongoDB is committed to helping developers focus on building next-generation apps and not on database operations. Likewise, Tableau's mission is to help people understand their data regardless of skill set or functional role.
To help you start analyzing faster, Tableau connects seamlessly to a broad range of data platforms. Tableau is also heavily invested in ensuring that queries run in their platform are returned at optimal speeds, regardless of platform. Speed to insight is a function not only of query performance but of the entire process of analytics being more agile.
That’s why we are excited not only to optimize the speed at which data stored in MongoDB can be processed, but also to make the entire user experience more intuitive and seamless. The ability to capture data without ETL or to painstakingly reformat documents into a relational schema results in a significant reduction of cost and complexity.
How teams are using MongoDB and Tableau
Big data today is not just limited to exploratory data science use cases. It's even being used for operational reporting on day-to-day workloads—the kind traditionally handled by data warehouses.
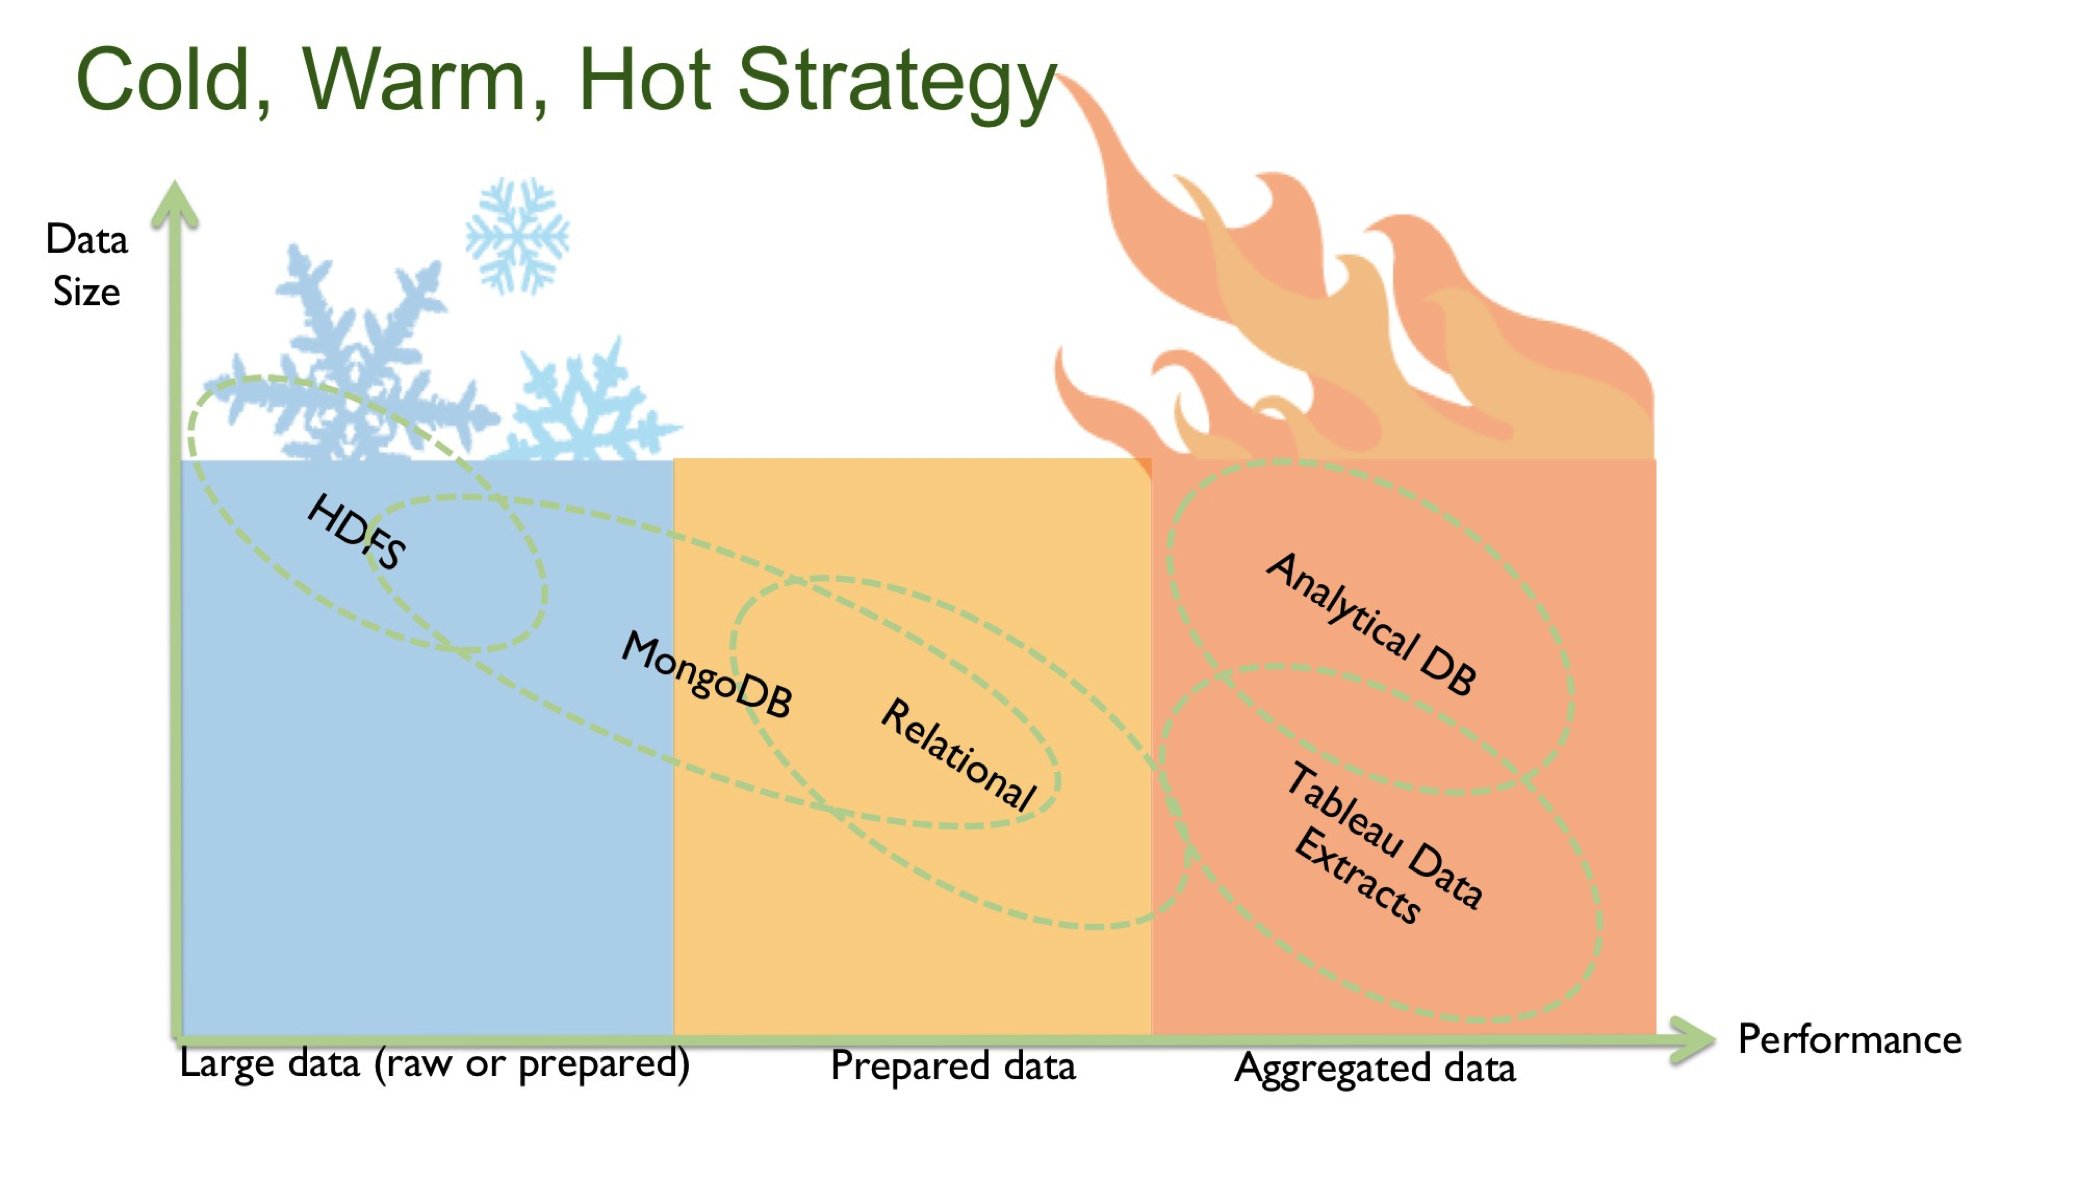
Modern organizations are responding to these hybrid needs by pursuing use case-specific architecture design. This design strategy involves tiering data based on a host of factors including volume, frequency of access, speed of data, and level of aggregation. Broadly, these tiers are:
- Cold: Data in its rawest form, useful for exploration on large volumes
- Warm: Aggregated data for ad hoc diagnostic analyses
- Hot: Fast data for repeatable use cases (KPI dashboards, etc.)
In most cases, organizations will use different stores for each tier. With that said, if a deployment is well-tuned and well-indexed, MongoDB can serve as a datastore for cold data (ex: data lake), warm data (ex: a semi-structured data warehouse), or hot data (ex: computational data stored in-memory).
This means there is a large spectrum of use cases for how MongoDB and Tableau can be deployed in parallel. For simplicity, we have grouped them into two main categories:
Data mining: Customers will simply use Tableau as a way to understand general trends and outliers of the data stored in MongoDB. Typically, this is performed by data scientists using Python, Scala, and Java to process data and use Tableau to provide quick insights.
Conceptual modeling: This category of use cases encompasses the use of Tableau to determine which parts of the data set is useful for answering conceptual questions. The narrowed-down data is then migrated into an analytically-optimized structure for more thorough manipulation before exposing it to business users.
See the connector in action
To demonstrate how the connector works, we will be using a MongoDB data set with information about 25,000 different New York City restaurants. Here’s what the documents look like:
> db.restaurants.findOne();
{
"_id" : ObjectId("5877d52bbf3a4cfc41ef8a03"),
"address" : {
"building" : "1007",
"coord" : [-73.856077, 40.848447],
"street" : "Morris Park Ave",
"zipcode" : "10462"},
"borough" : "Bronx",
"cuisine" : "Bakery",
"grades" : [
{"date" : ISODate("2014-03-03T00:00:00Z"),
"grade" : "A",
"score" : 2,
"inspectorID" : "Z149"},

{"date" : ISODate("2013-09-11T00:00:00Z"),
"grade" : "A",
"score" : 6,
"inspectorID" : "Z126"},

{"date" : ISODate("2013-01-24T00:00:00Z"),
"grade" : "A",
"score" : 10,
"inspectorID" : "Z39"},

{"date" : ISODate("2011-11-23T00:00:00Z"),
"grade" : "A",
"score" : 9,
"inspectorID" : "Z204"},

{"date" : ISODate("2011-03-10T00:00:00Z"),
"grade" : "B",
"score" : 14,
"inspectorID" : "Z189"}],
"name" : "Morris Park Bake Shop",
"restaurant_id" : "30075445",
"avgprc" : NumberDecimal("12.2500000000000")
}
As you can see, this collection contains data points you’d expect (address, cuisine, etc.), but it also contains time-based sanitation grade ratings as a nested array. In a relational schema, you might expect to see this data stored in a different table whereas in MongoDB, it can be retained within the restaurant object.
To transform this database into a form that a SQL-based tool can parse, we use the "mongodrdl" utility to create the mapping file.
Inspecting the output file will reveal that the nested arrays have been transformed into relational tables. Indeed, connecting to the file from the MySQL shell reveals the new schema:
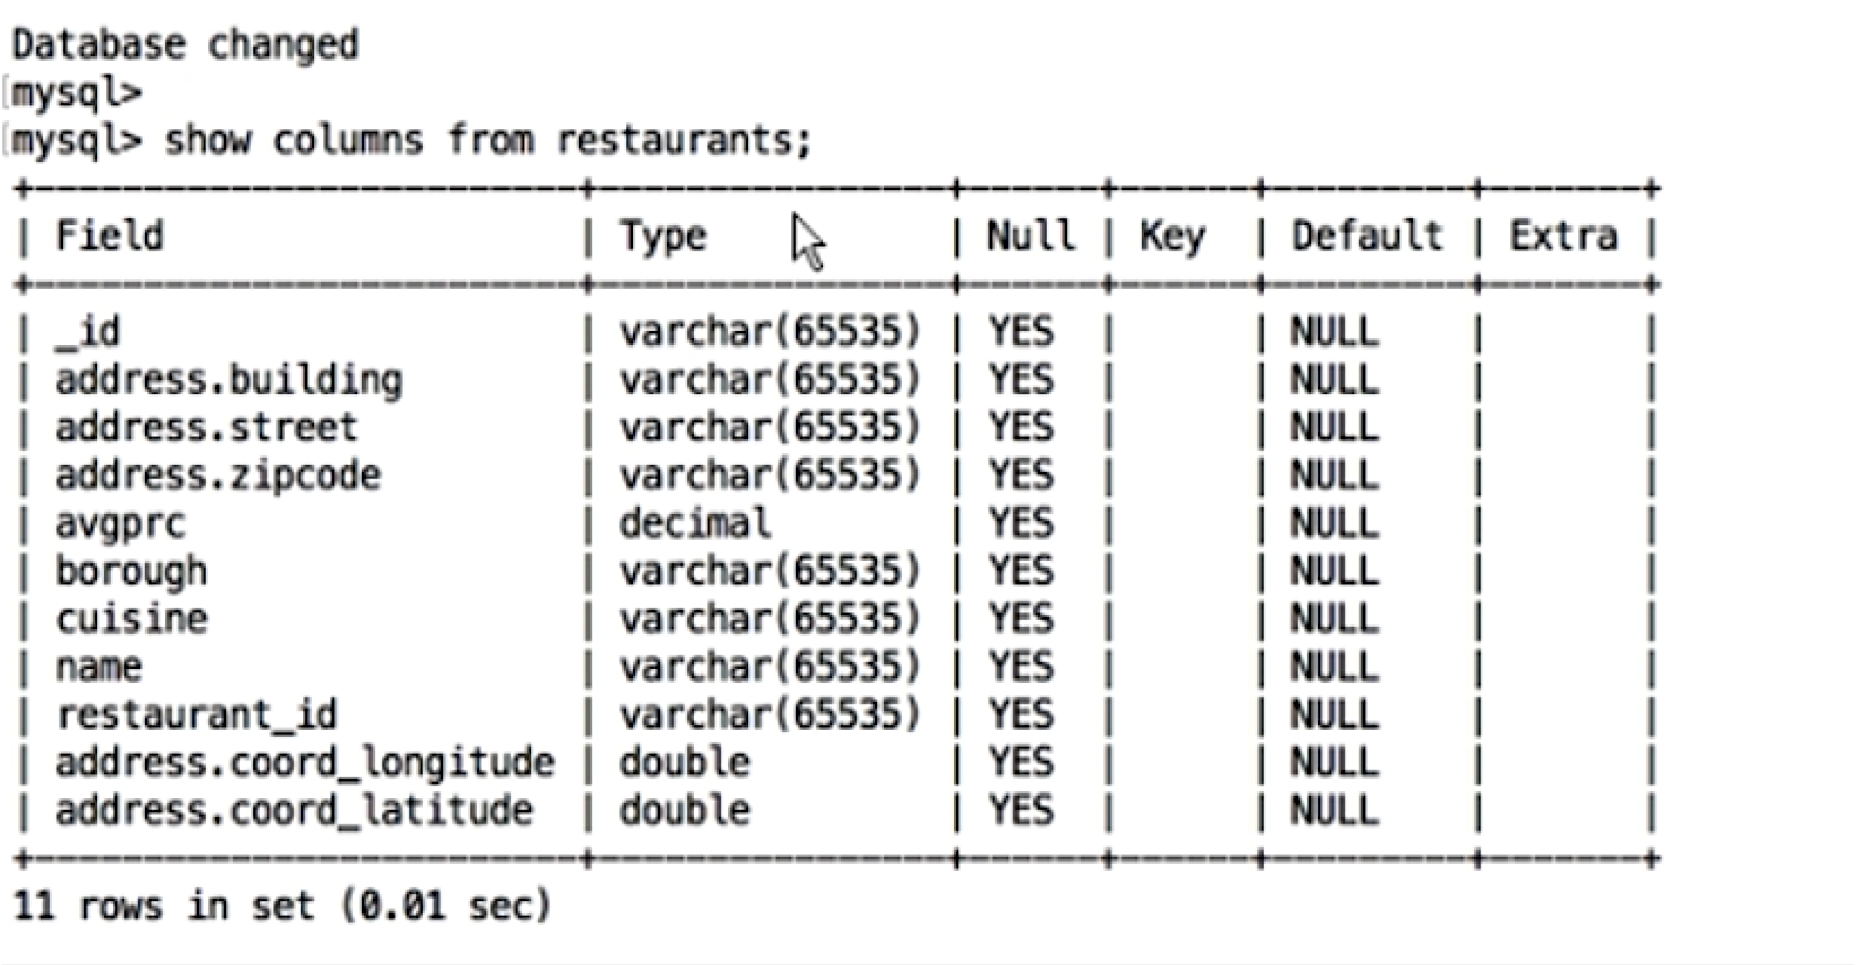
Notice how the geospatial data in the source document ("address.coord") was transformed from an array to two doubles corresponding to longitude and latitude.
In MongoDB:
"coord" : [-73.856077,40.848447],
Output from the connector:
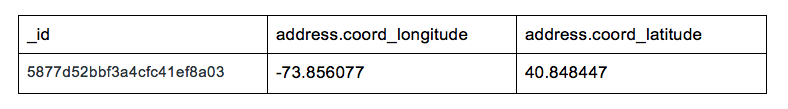
What’s more, if you manipulate data in your original MongoDB collection, the changes will map in real-time to the output file.
Now that our data is in a form that a SQL-based tool can understand, let’s move into Tableau.
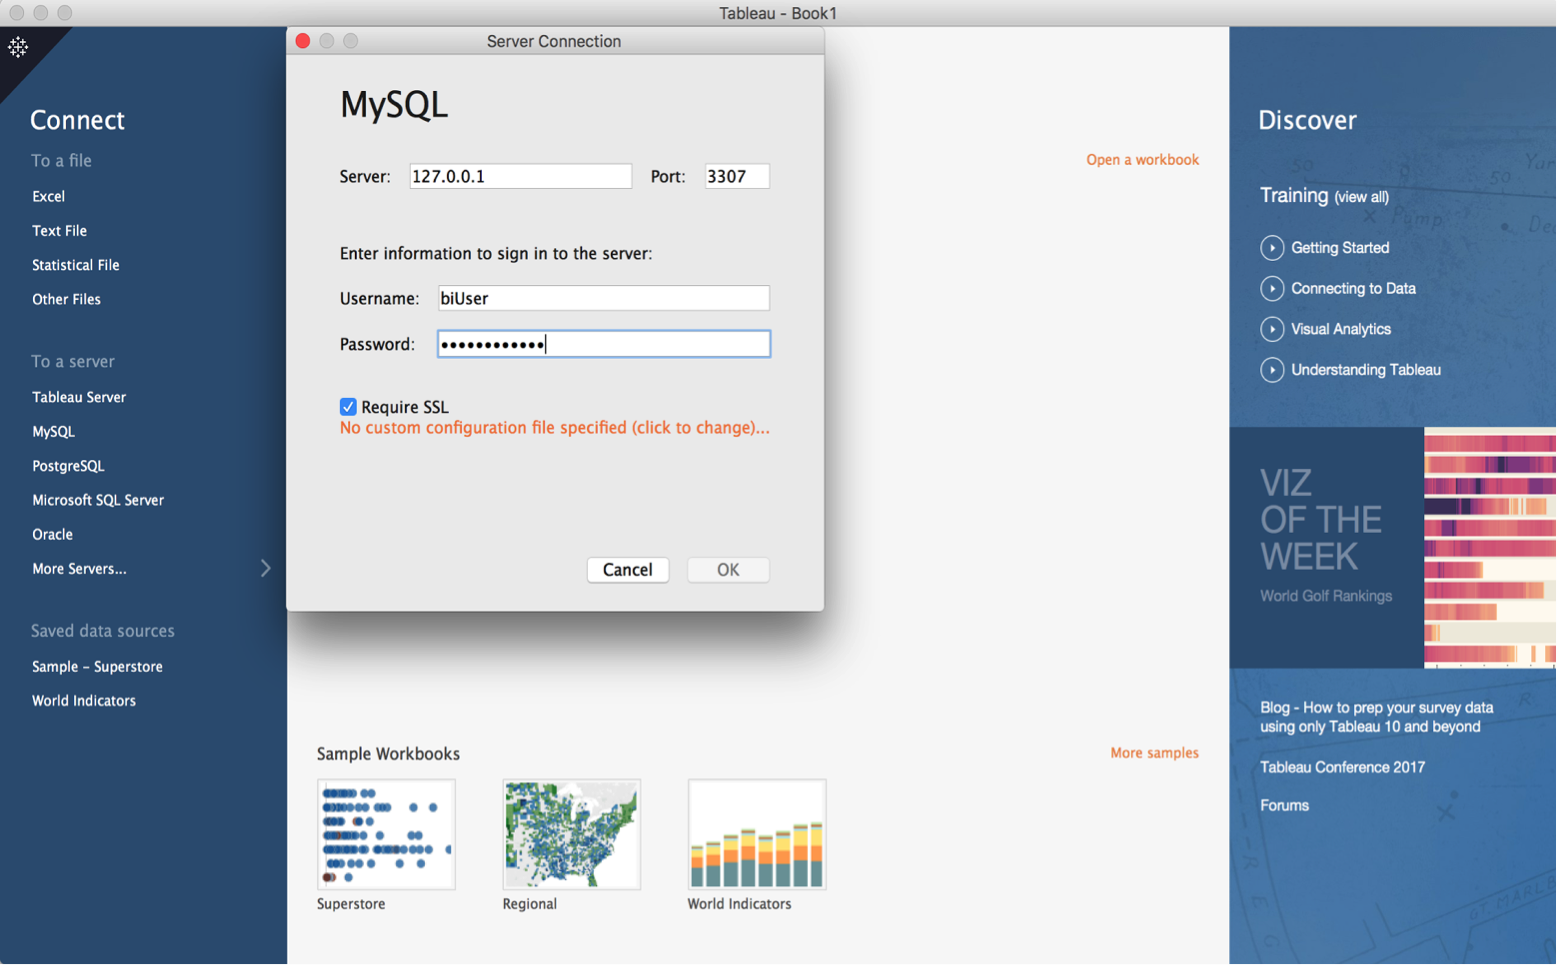
When connecting to the server through Tableau, we select “MySQL” as that is how Tableau is reading our mapped data set.
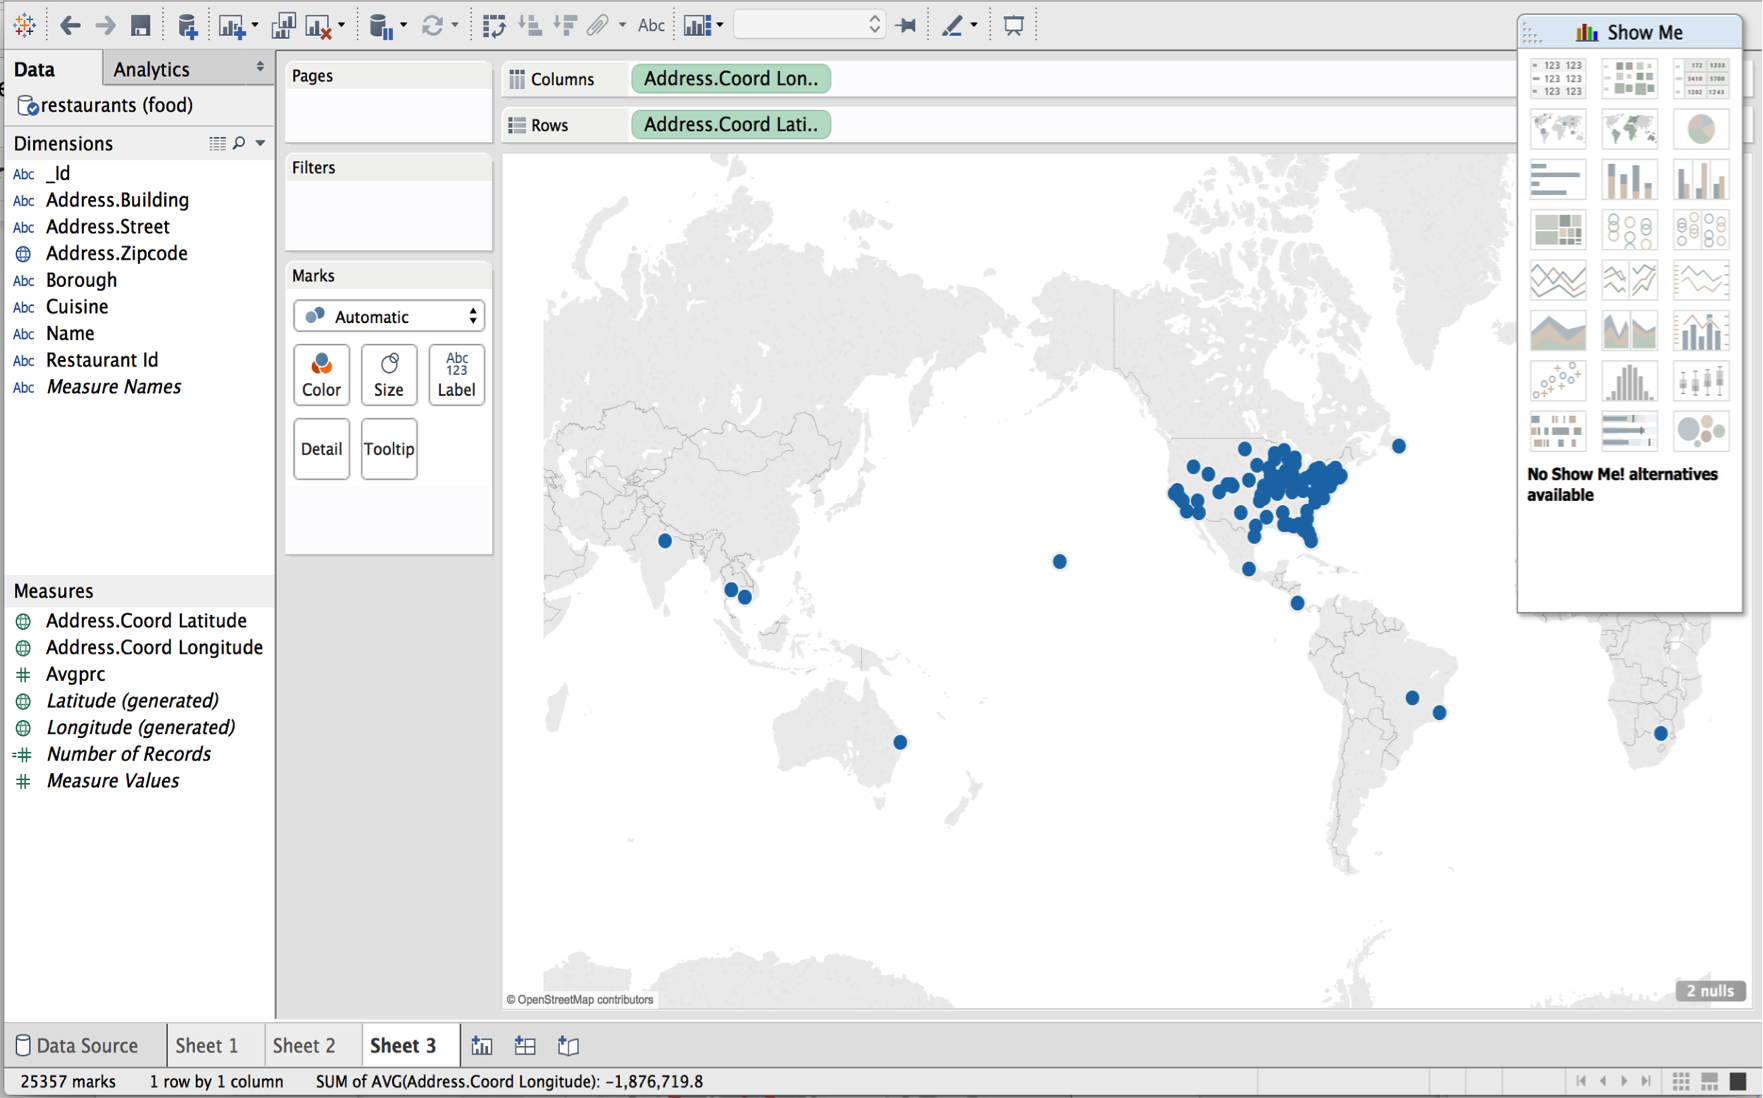
You will then see that all the data has been pulled into Tableau with their correct types. For example, if we drill down on our longitude and latitude columns, Tableau knows to toggle into geo mode:
This allows us to create interesting visualizations with our MongoDB data. Say we want to zoom into New York City and filter by Asian and Chinese cuisine.
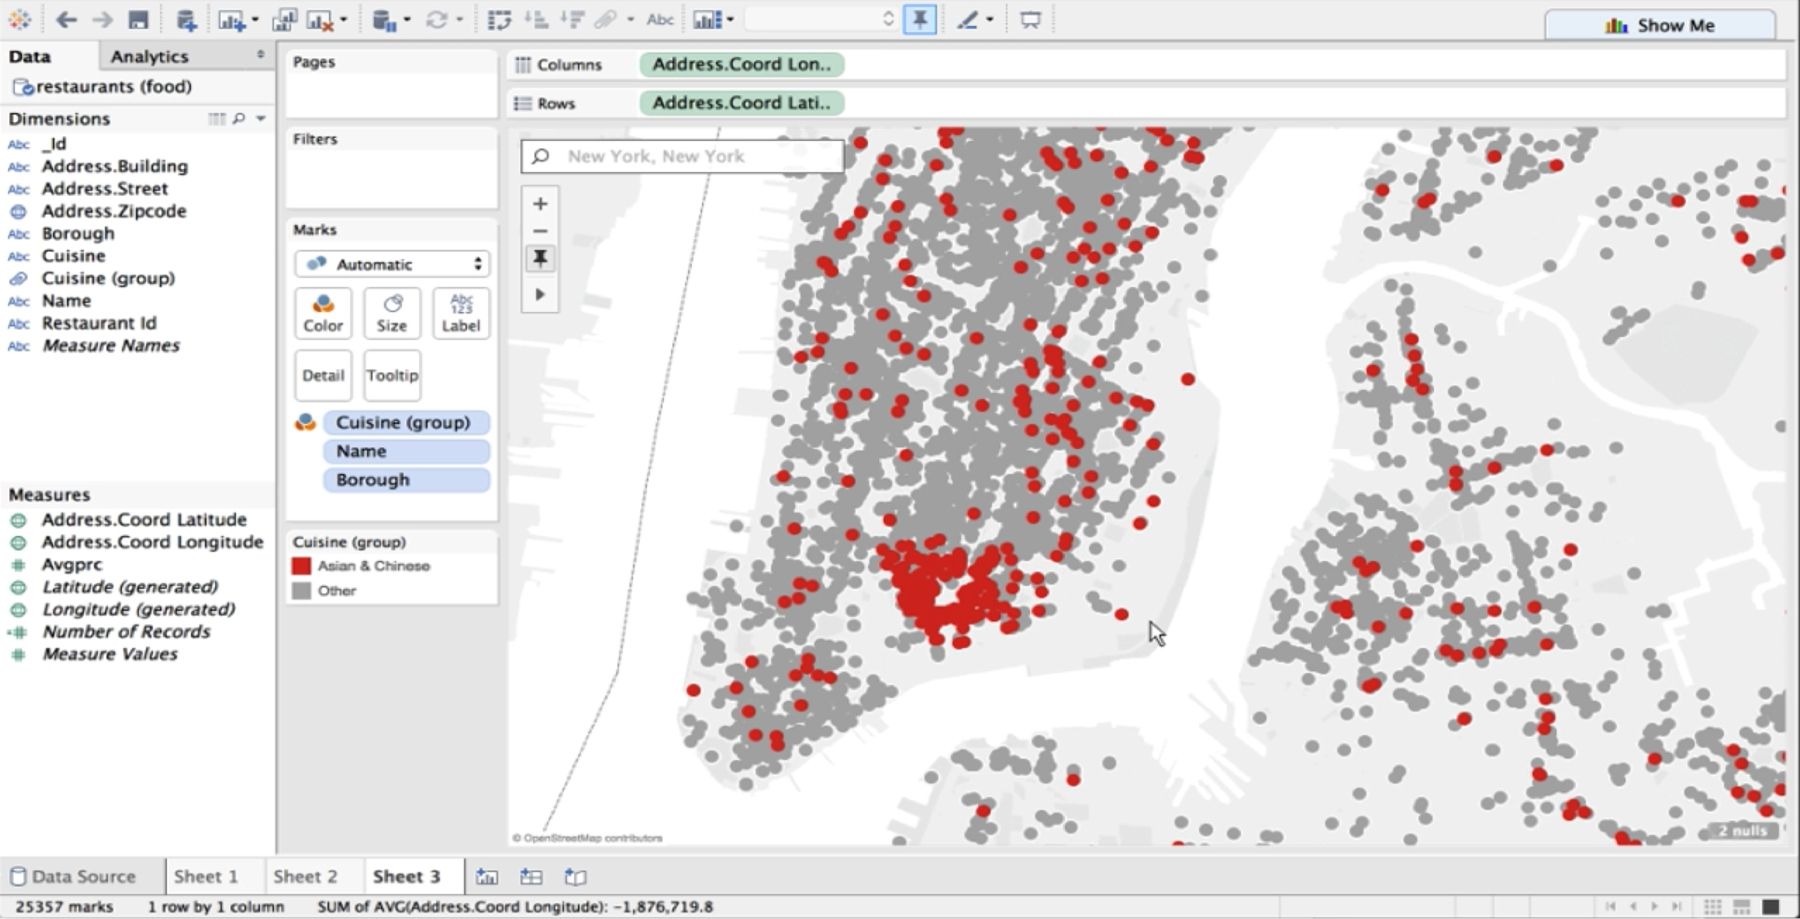
You’ll notice a big cluster on the southeast side of Manhattan. We've found Chinatown!
Be sure to watch the full demo to see Buzz explore all of the various ways the connector can be used to pre-aggregate data, hide particular fields, and even do field-level dynamic redaction of data.
Best practices for using MongoDB with Tableau
When preparing a data set stored in MongoDB for analysis in Tableau, be sure you are following MongoDB best practices. Do you have indexes on frequently-queried fields? Have you pre-joined tables as nested arrays (like the sanitation grades example above)?
As we saw with the translation of geospatial arrays into longitude and latitude doubles, there is great value in letting your data types flow into Tableau. Avoid obscuring rich types like datetimes and decimal by down-converting them to strings.
Avoid casting. Some of these operations will be processed in the connector itself, not in MongoDB. For example, complex date arithmetic is not yet pushed down into MongoDB and can greatly impact latency.
Modeling MongoDB for use (with clever partitioning and denormalization), and tuning it effectively is also one of the basic tenets that will help you author efficient Tableau dashboards and reports on it. After all, Tableau cannot be faster than the data source itself. However, as a Tableau user, if you’re up against a poorly-tuned database instance, you can always use Tableau’s fast data engine to improve query performance.
These in-memory “snapshots” of data called extracts are useful in a variety of ways. Imagine a scenario where the SQL-to-MQL translation is taking time, and you urgently need to show something to your stakeholder. With Tableau, you can simply explore a concept on billions of rows via direct query, but to share that you can just grab the top 10% of the rows, put together a quick dashboard, persist it into an extract and send it to your stakeholders as a prototype to create a discussion point. This allows you to be agile in that analytical process.
Extracts can be great if you want to take your analysis with you on a plane or need offline access, or if you have a large number of users and want to reduce the load on the MongoDB cluster.
These and many other best practices for workbook performance are covered in great detail in this TC16 talk by David Spezia as well as in this ever-popular whitepaper by Tableau’s Alan Eldridge.
Frequently-asked questions
Should I use the Connector for BI or Tableau Data Extract?
Remember that Tableau will not be able to run queries faster than MongoDB allows. If your data is under-optimized, you may want to consider using a Tableau Data Extract instead. Extracts can also be a helpful tool to augment query speed; , however, they work better for smaller datasets (fewer than 100,000,000 records, 100 columns, etc.). Extracts can reduce load on MongoDB cluster if your cluster is being accessed by many users
Is the Connector for BI available for the MongoDB community?
At this time, the Connector for BI is available as part of MongoDB Enterprise Advanced.
What kind of overhead do the connector and Tableau add to MongoDB response times?
Unless you're running into edge cases where processing is happening in the connector rather than in the database, you will not notice additional latency.
With the previous version of the BI Connector, we ran into issues with joins between collections. The recent release of the Connector for BI (v2.0) introduces significant performance enhancements for these use cases over v1.0.
Be sure to watch the full demo here, and download an evaluation version of the Connector for BI 2.0 for yourself!
相關文章

How to Embed a Data Viz from Tableau Cloud into Your Google Docs
 2023/08/16

Intro to the Salesforce Developer Universe
 2023/05/05

Calling all Tableau Developers for TrailblazerDX 2023
 2023/02/01
Subscribe to our blog
在收件匣中收到最新的 Tableau 消息。