Best of the Tableau Web: July 2015


Much like cycling fans following their favorites in the Tour de France, I spent the month of July tracking the best of Tableau and data visualization content out there so that I could turn around and tell you all about it. Pretty nice of me, huh?
Each morning, I’d read the previous day’s recap of the Tour and scan my favorite Tableau blogs and our Twitter stream. My awe of the content created by the Tableau community was a close contender for my awe of the athleticism of the Tour. I’ll never be a visual analysis guru and I’ll never be a professional cyclist, but it’s my absolute pleasure to deliver this roundup with a hearty dose of Tour de France terminology!
Attack
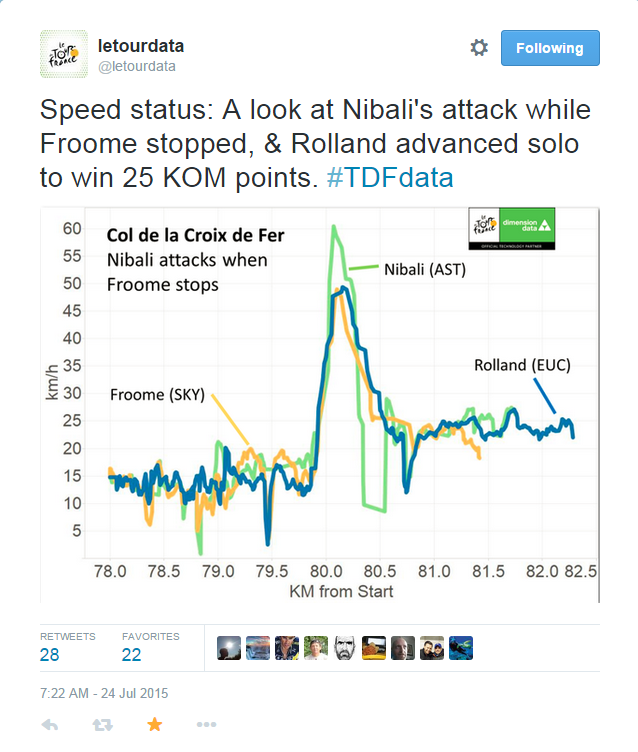
Tour term: When a rider suddenly accelerates to break away or open a gap on other riders (see #TDFdata viz below)
BotW term: When a Tabloid suddenly accelerates in awesomeness to break away from the average user. These posts struck me as exceptionally awesome, thought-provoking, or useful.
The Information Lab Aggregate Measures = Tableau Hot Sauce
Tableau Love Customizing Tableau TabJolt Load Tests
The Information Lab 5 Things to Know about the Tableau 9.1 Web Data Connector
VizCandy Dashboard Kitsch (inclues gnomes!)
The Last Data Bender Designing Efficient Workbooks
Drafting
Tour term: Riding close behind another rider to benefit from the lack of air resistance.
BotW term: Making life easier with time- and energy-saving tips.
Vizible Difference Coding Case Statement Made Easy
Tableau Zen Fuzzy Matching to a List using Parameters in #Tableau
Vizible Difference Replacing Data Source the Fast Way
Rouleur
Tour term: A rider who specializes in steady, consistent riding, able to assist the leader for hours at a time.
BotW term: Solid, helpful tricks that may not blow you out of the water but are solid to have in your toolkit.
Interworks How to Create Dynamic Tableau Dashboard Layouts with Sliding Containers
Data Revelation Things You Should Read This Week (= newsletter doing my job for me)
Wannabebe Data Rock Star Makeover Monday - Chocolate
Inviso 4 Fair Questions Every Tableau Newbie Will Ask
Sprint
Tour term: A short, sharp dash, extremely draining for riders.
BotW term: Awesome results but may require a bit of extra effort; Jedi-level tips.
Data Science Riot How to Forecast with Tableau and R
Esri How to Use ArcGIS Data, Features and Basemaps in Tableau
Tableau and Behold! Paginating via tabcmd for Full Exported PDFs
Drawing with Numbers Counting Pairwise Similar Votes in Tableau
Data* Science + R Scatter Plots with Marginal Densities
The Information Lab Data School Introduction to Spatial Analytics
Inviso REST API Examples
James Dunkerley's Blog Rounding Calculations in Tableau (and Excel and Alteryx)
3danim8 Using #Tableau Ver 9.1 to Display 3D Data
Domestique
Tour term: A rider who supports the lead rider.
BotW term: Partner technologies that make Tableau even more awesome.
ClearPeaks Blog Big Data Ecosystem – Spark and Tableau
Facebook Junkie Facebook Web Data Connector
Interworks Import.io Web Data Connector
DataBoss MongoDB Web Data Connector for Tableau
Tuck
Tour term: A technique where riders change their body shape to increase speed on downhills. Can make the rider less stable.
BotW term: Hacks that can be awesome but may not be formally endorsed by Tableau.
Tableau Tinkering Tinkering with Bars in Trees
Tableau and Behold! Adding a Language to Tableau Server
DataToffee How to Read JSON Data in Tableau
Dueling Data Tableau Clocks
Tableau and Behold! Tableau 9.0, Vizportal, and Forcing Password Security
I’m really indecisive. Picking what qualified as the BEST of the web was painful, grueling, and perhaps my very own Stage 19 ride through the Alps. I didn’t do a very good job culling. Here, I present the peloton.
Peloton
Tour term: The middle-of-the-pack riders who group up for efficiency.
BotW term: The middle-of-the-pack content that may not be breaking any records but is still definitely in the race.
Drawing with Numbers Keeping a Value in Totals Whilst Excluding from Quick Filter List
Corporate Renaissance Group How to Use a Fixed LOD Expression to Manage Multiple Fact Tables in a Join
VizWiz Tableau Tip Tuesday: Tips & Tricks from the Zen Master Panel at #DATA15
Tableau Wannabe Podcast Behind the Viz with Andy Cotgreave
The Don Data Flow Chart / Flow Diagram / Decision Tree in Tableau
相關文章

Meet Iron Viz 2024 Finalist Jessica Moon
 2024/04/15

DataFam Roundup: April 8–12, 2024
 2024/04/12

Meet Iron Viz 2024 Finalist Pata Gogová
2024/04/08
Subscribe to our blog
在收件匣中收到最新的 Tableau 消息。