
Incorporating maps into your analysis, reports and dashboards should be as common as creating another bar chart, pie graph or data table.
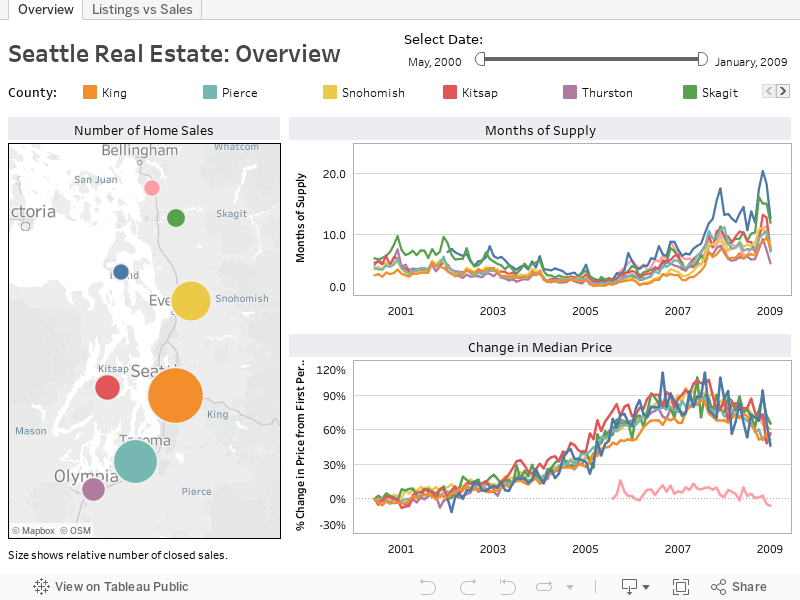
Perform detailed analysis using demographic data
and built-in mapping capabilities
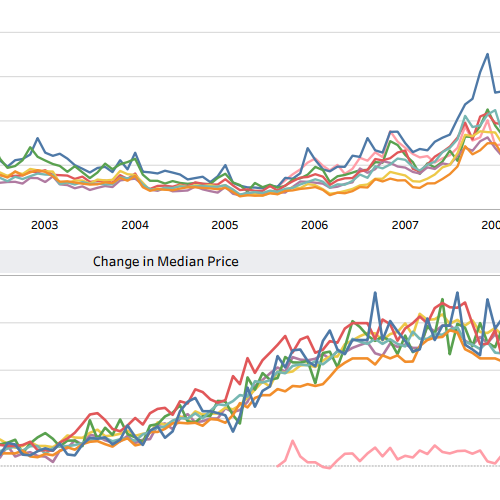
Present enormous countrywide datasets
clearly and allow drill-down to local areas
Analyze geographical buying behavior
based on product types
Identify and mitigate risk and efficiencies
across geographies
Analyze revenue and profit by region
Full-version trial. No credit card required.
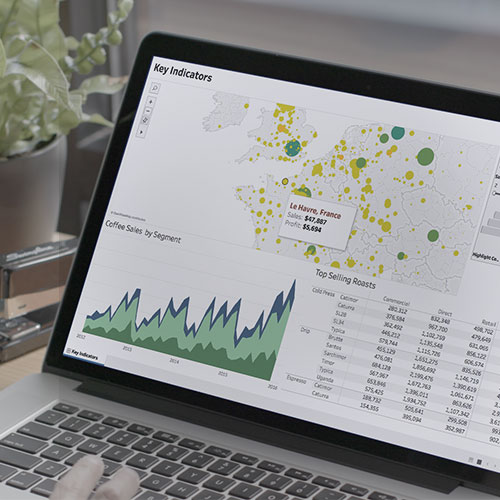

We use the mapping feature in Tableau a lot because, as a cable company, our regional differences are very important. Using traditional tools like Excel, it’s difficult to get a sense of what the geographic data means without actually seeing it. When you see the data on the map, you can actually see what it means and what the different regions are.
媒体报道