Tableau Foundation Living Annual Report
The Tableau Foundation's Living Annual Report shows you what we’re up to this week—not just what we did last year. Unlike traditional printed reports, our report, which updates weekly, allows anyone to interact with the data and ask follow-up questions.
We're sharing our report here to show that foundations and non-profits can move beyond the traditional annual report. With this approach, organizations can share the latest information and cut the time and costs of producing a traditional printed piece.

Create and share on Tableau Public
Join the newsletter and find daily inspiration with the Viz of the Day. Yours could be featured next!
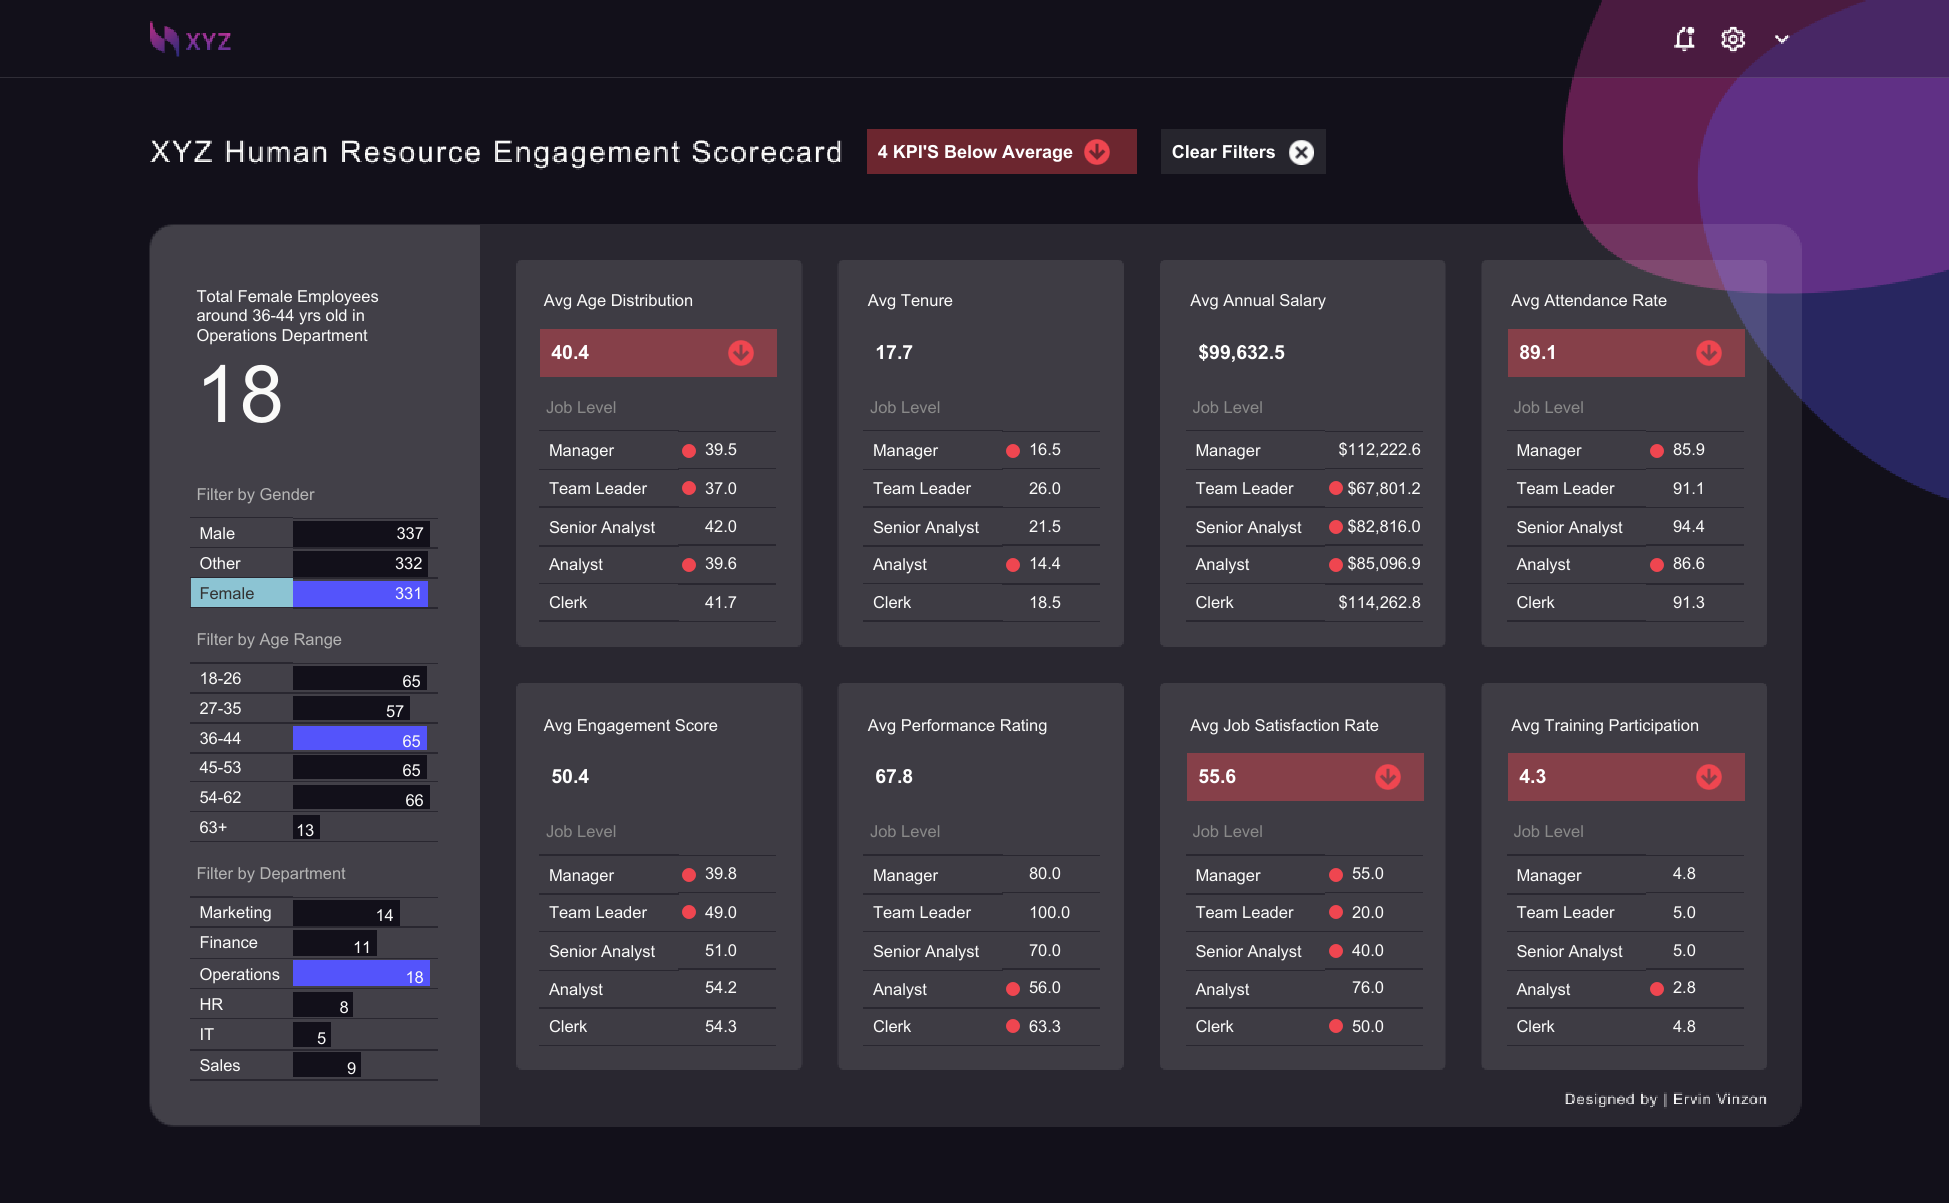
XYZ HR Engagement Scorecard
Learn how BANs can help you clearly display key metrics with this #VizOfTheDay by Ervin Vinzon. This Back 2 Viz Basics (#B2VB) entry visualizes employee engagement metrics using mock data by Adam Mico's GPT, Data Mockstar.
Interact with the viz