Your Favorite Vizzes - A Look Back at May 2021


Dig into our monthly blog series, A look back at your Favorite Vizzes, to see some of the most popular data visualizations from the #DataFam. Check out May’s most favorited and viewed vizzes across the Tableau community.
Top 3 most-often favorited Viz of the Day (#VOTD) featured on Tableau Public:

A criminal justice system universe? Check out this network chart #VOTD by Ken Flerlage—based in Williamsport, Pennsylvania in the United States—to see the Law & Order universe and how different characters crossover between the shows. Favorite this viz
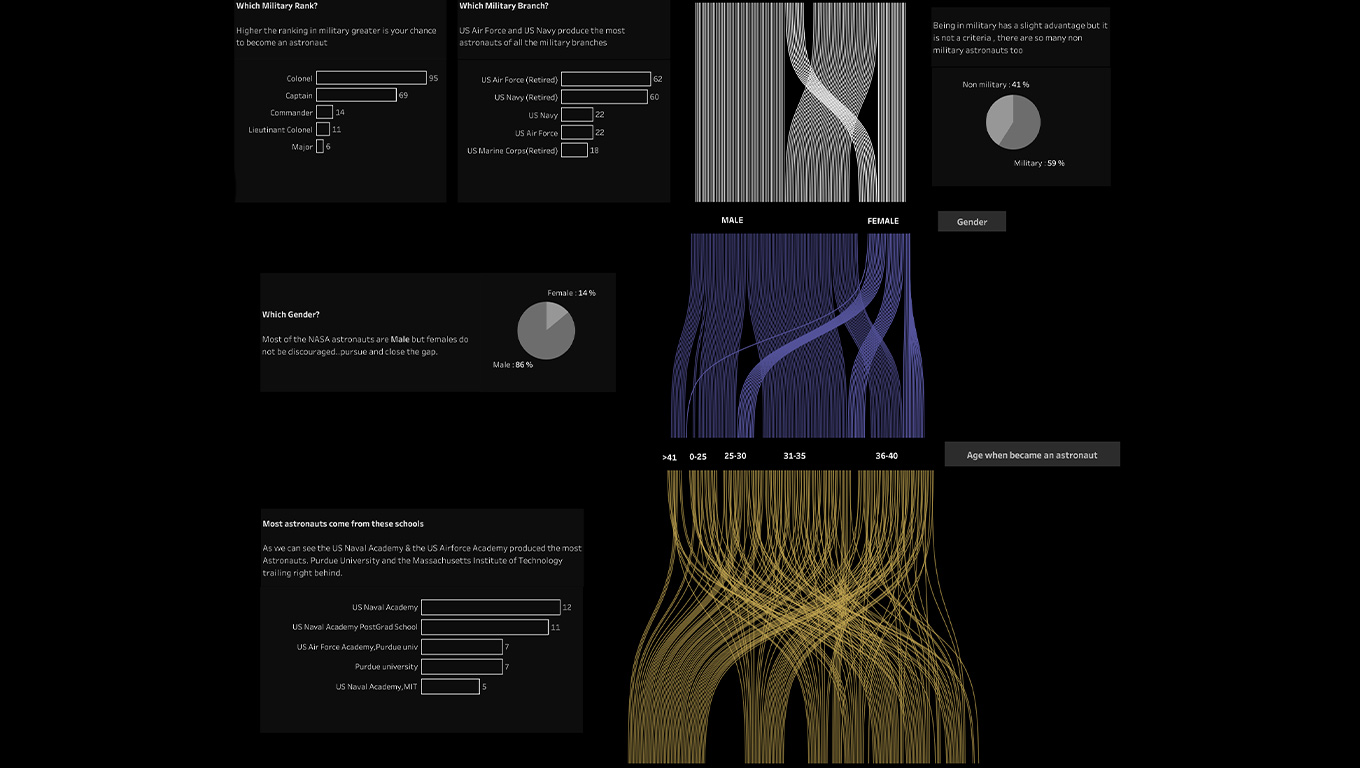
Do you have the right stuff to become a NASA Astronaut? Explore this #VOTD by Vinodh Kumar—located in Chennai, Tamil Nadu in India—to see age, graduate majors, military rank, gender, country of birth, and more details of those who have become astronauts throughout history. Favorite this viz

Can you name the singer, actress, fashion designer, and businesswoman who has spent the most days on the top of Billboard's Hot 100 Chart since 2000? Find out in this #VOTD by Márton Balla–located in Hungary–and see the number one hits from a variety of top female artists. Viz inspired by CJ Mayes Favorite this viz
Top 3 most-favorited non-VOTD on Tableau Public:
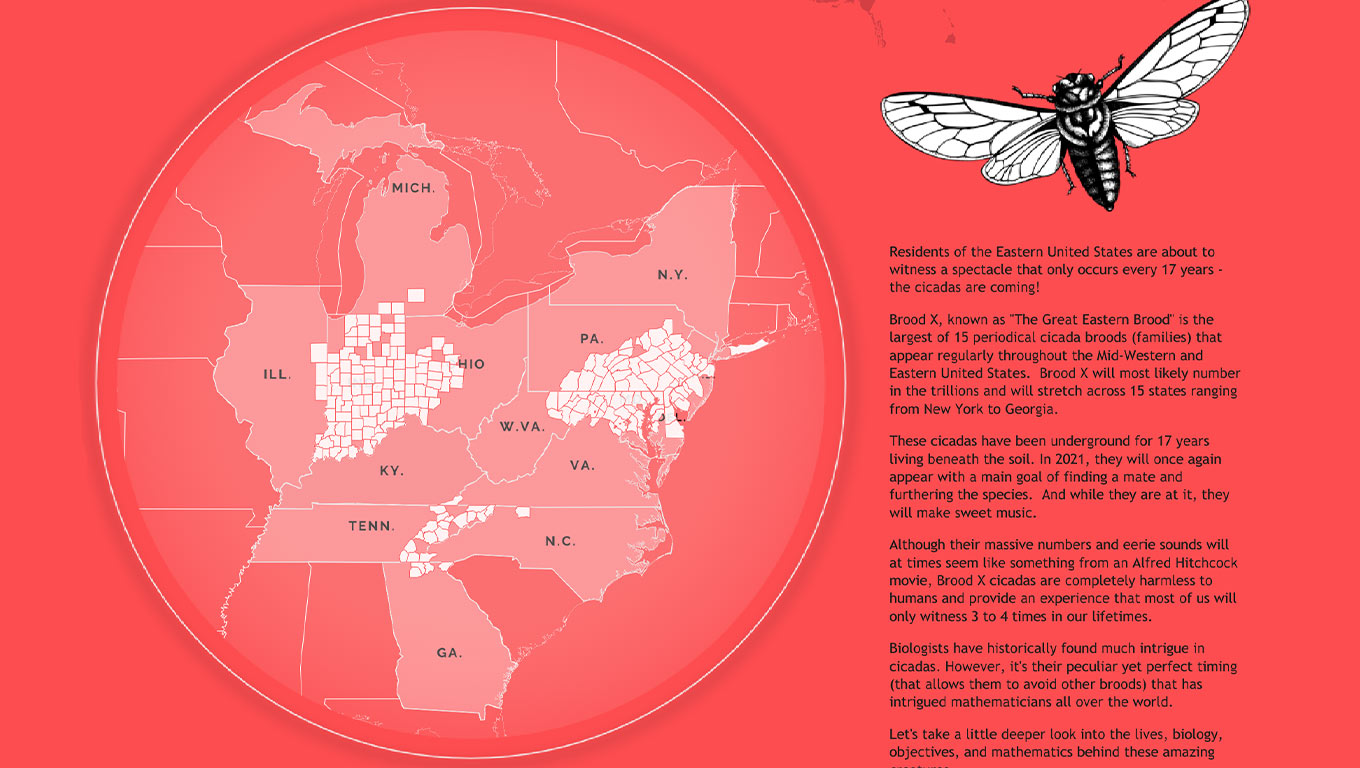
In this collaboration, Kevin Flerlage and Jeffrey Shaffer—based in the United States—showcase "The Great Eastern Brood", the cicadas broods spectacle that occurs every 17 years in the Eastern part of the United States. Favorite this viz

In this visualization, Will Suton— located in London, United Kingdom—illustrates "The Gutenberg Diagram", a handy principle of design that helps you understand how a user will read a dashboard or page of information. Favorite this viz
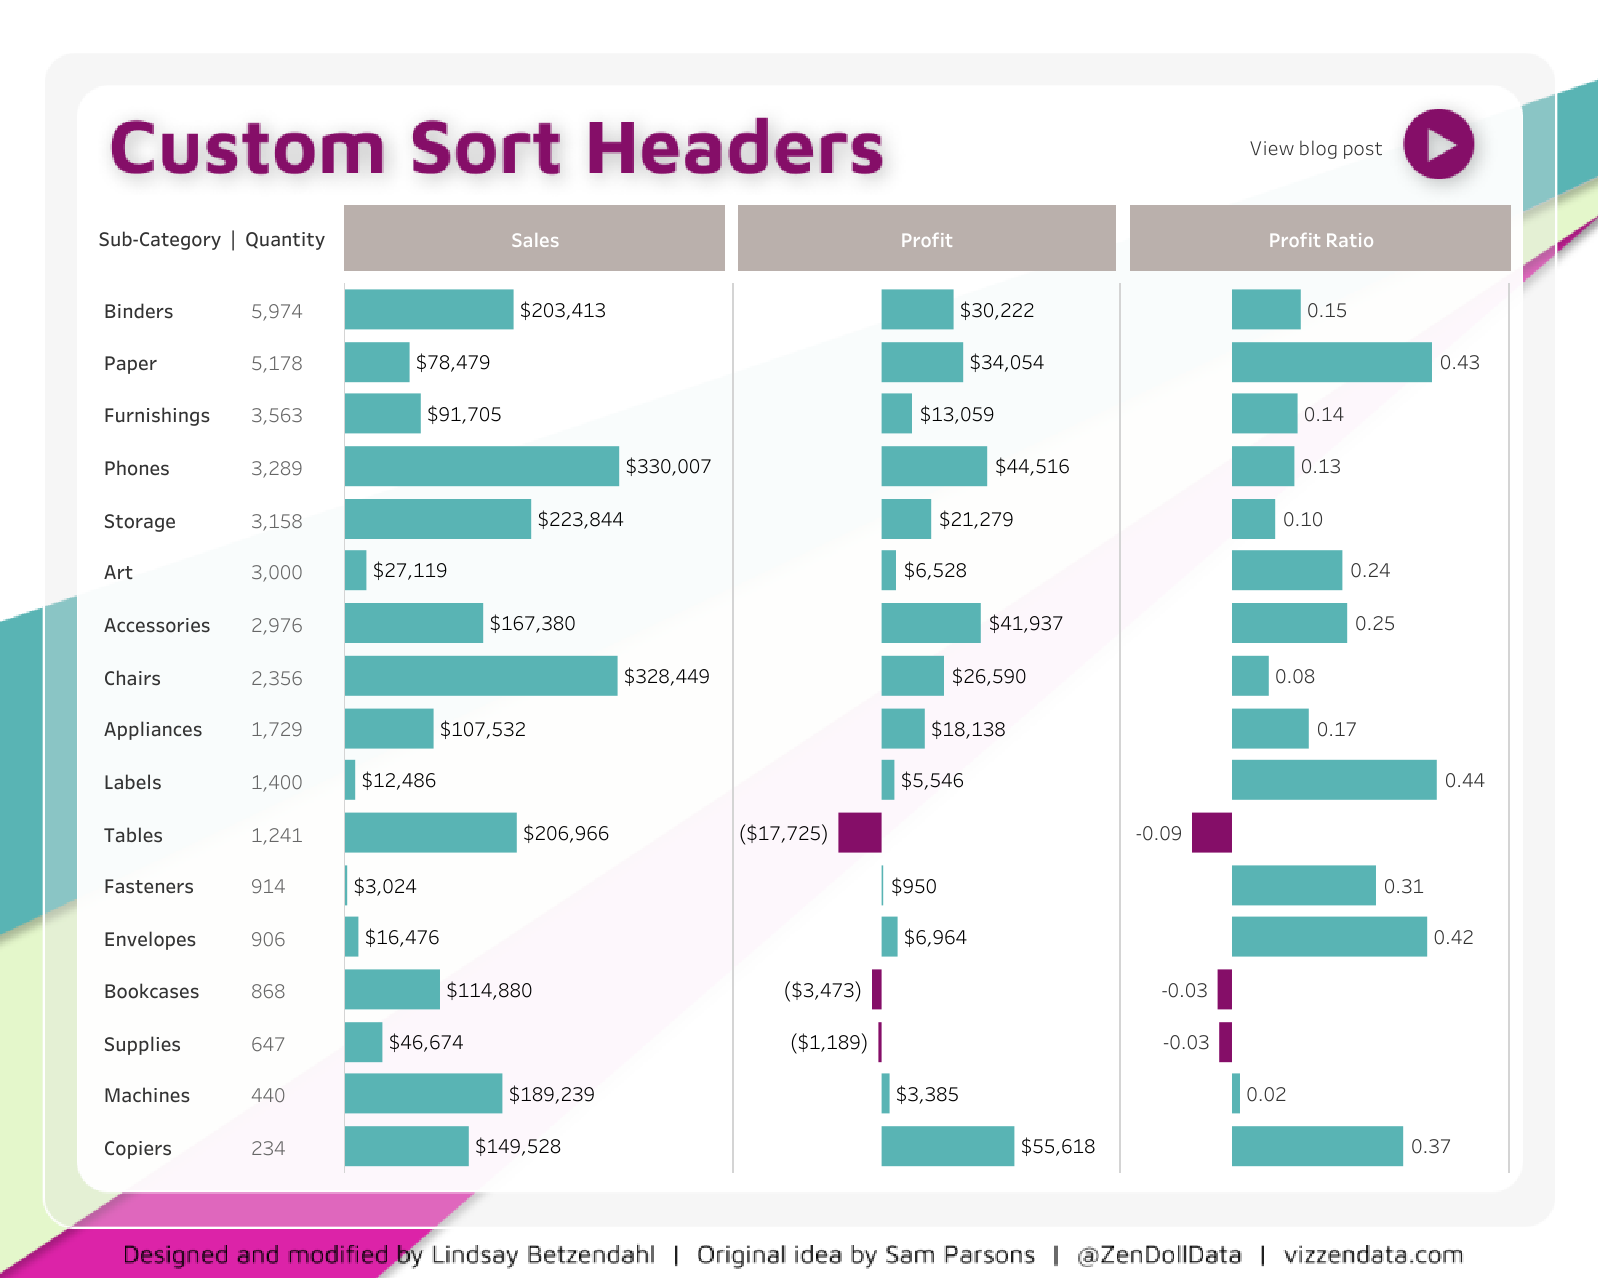
Explore Lindsay Betzendahl's visualization, that will help you learn how to create custom sorting worksheets to help improve UX on your small multiple charts. Favorite this viz
Most popular VOTD on Twitter:
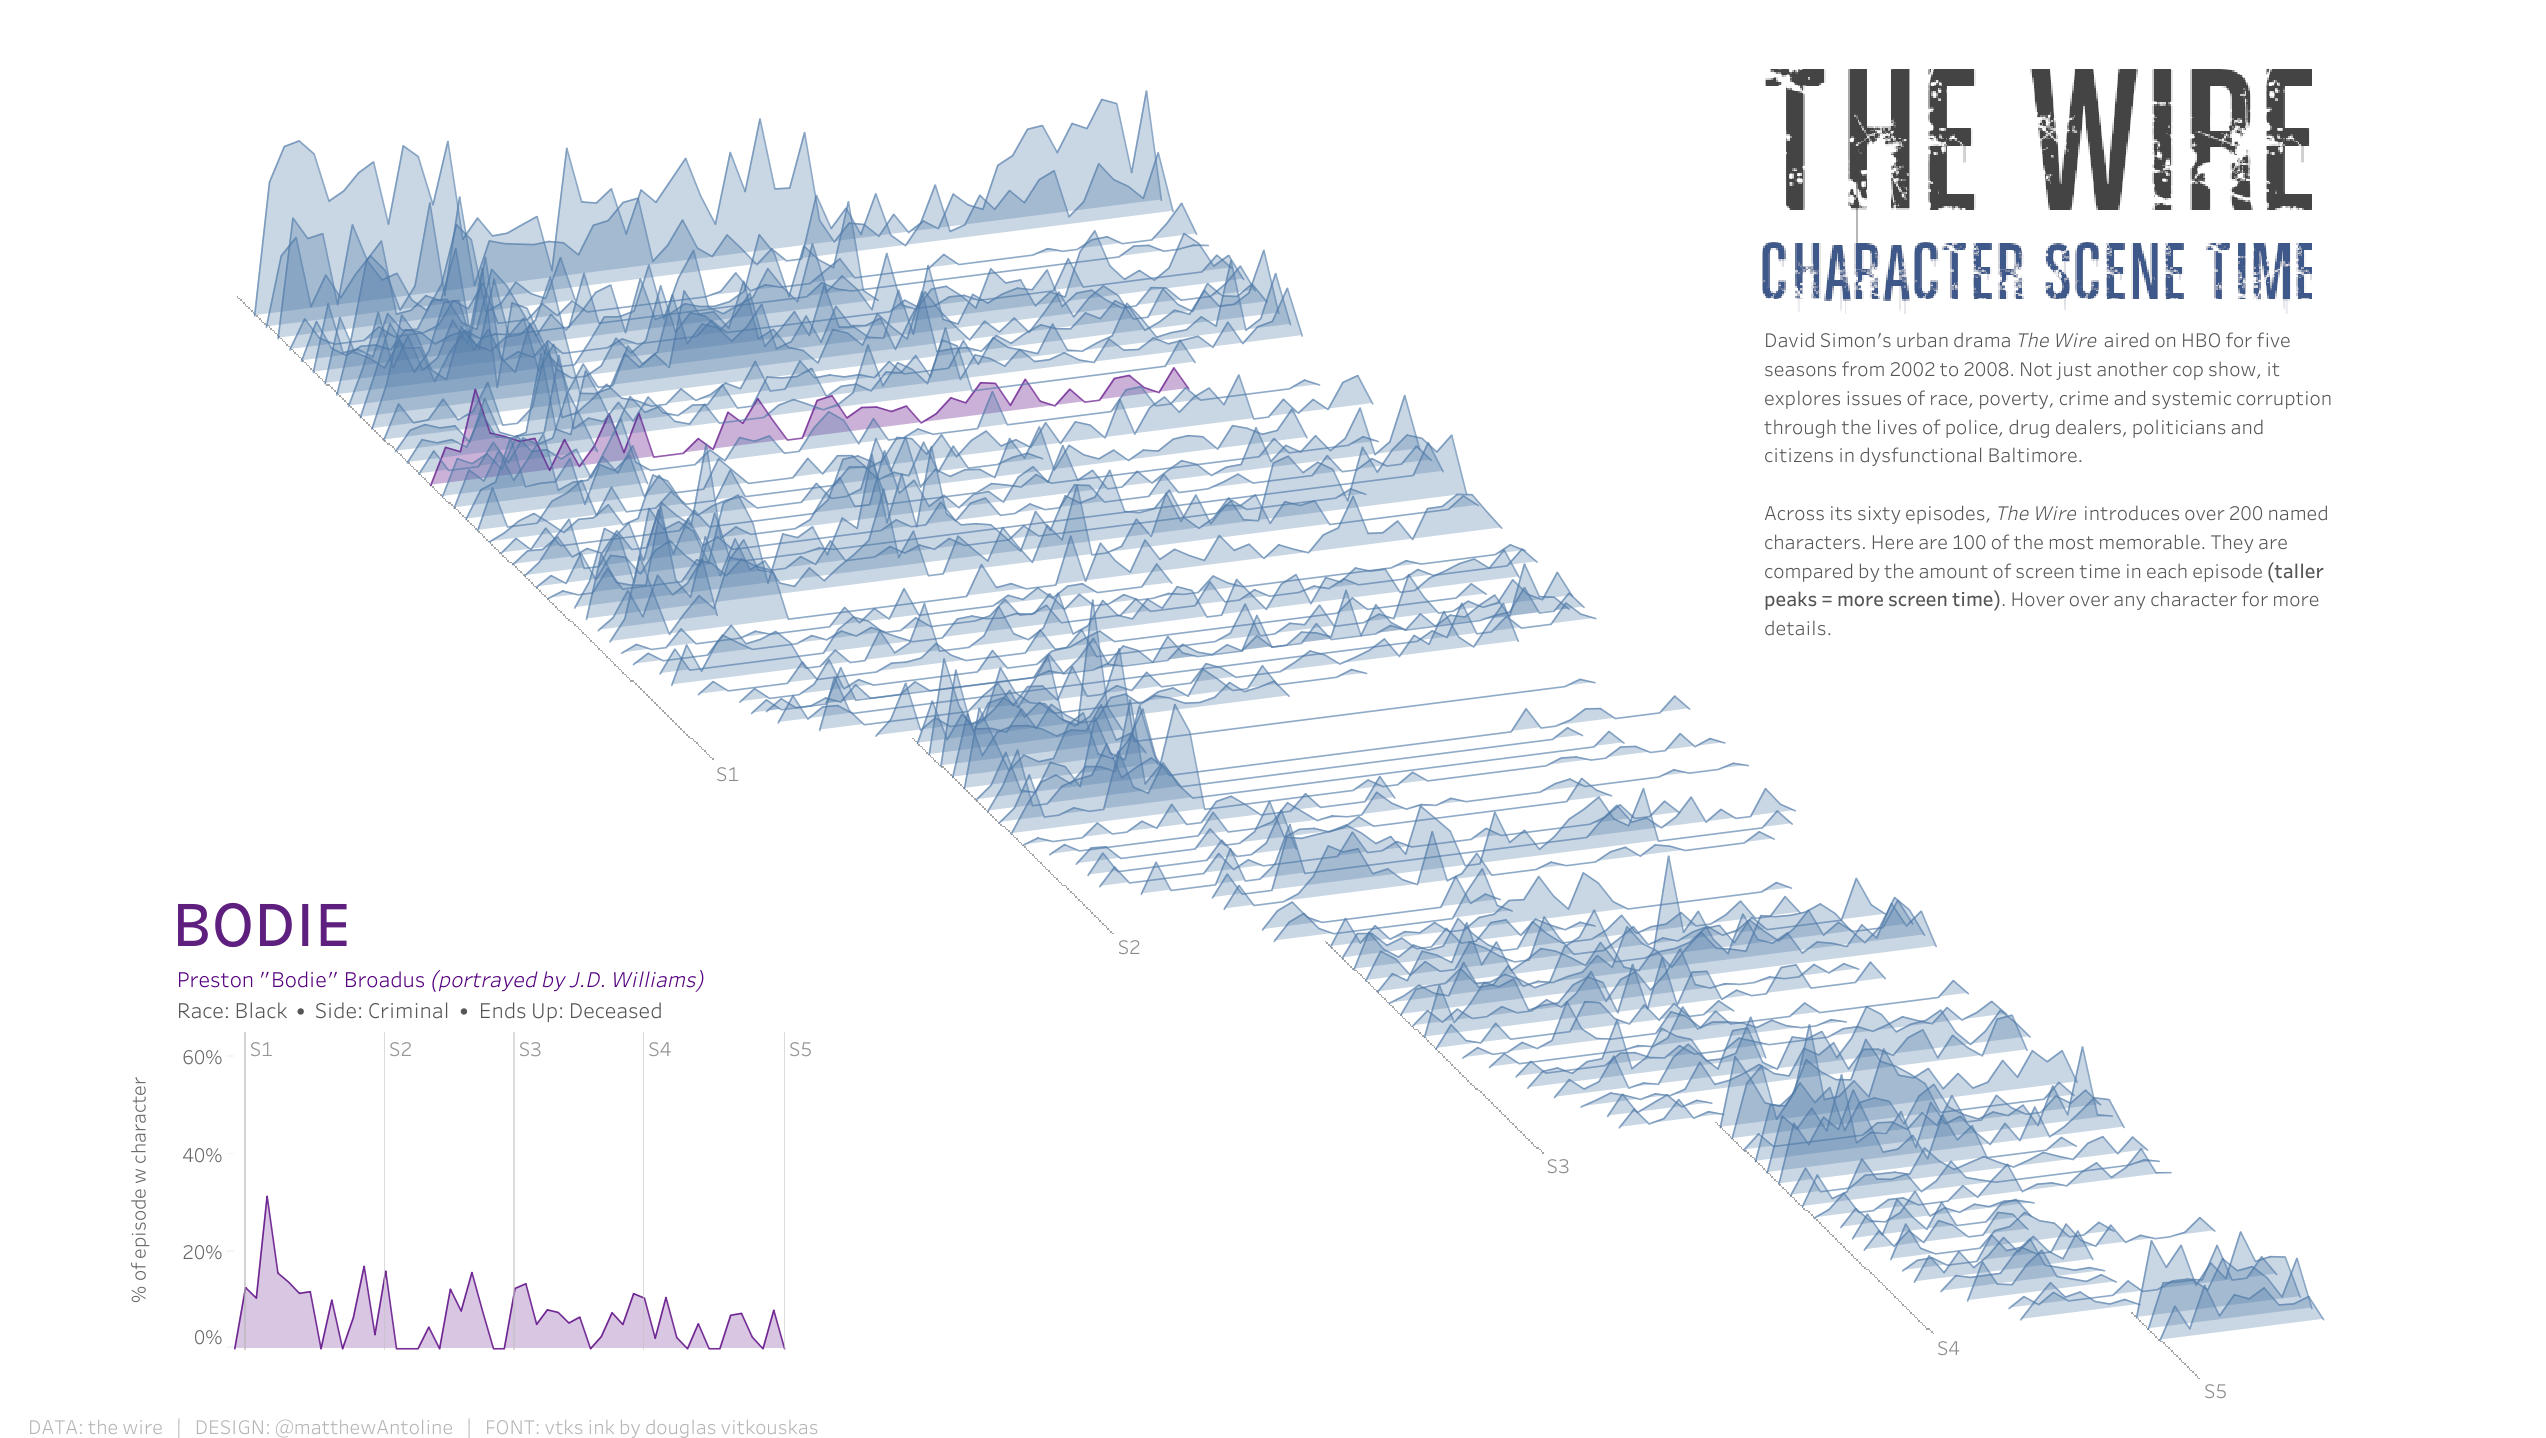
Who's your favorite character from The Wire? Explore this #VOTD by Matthew Antoline—located in Newark, Delaware in the United States—to see screen time comparisons among 100 of the most memorable characters from David Simon's crime drama television series. Favorite this viz
Most popular VOTD on Facebook:
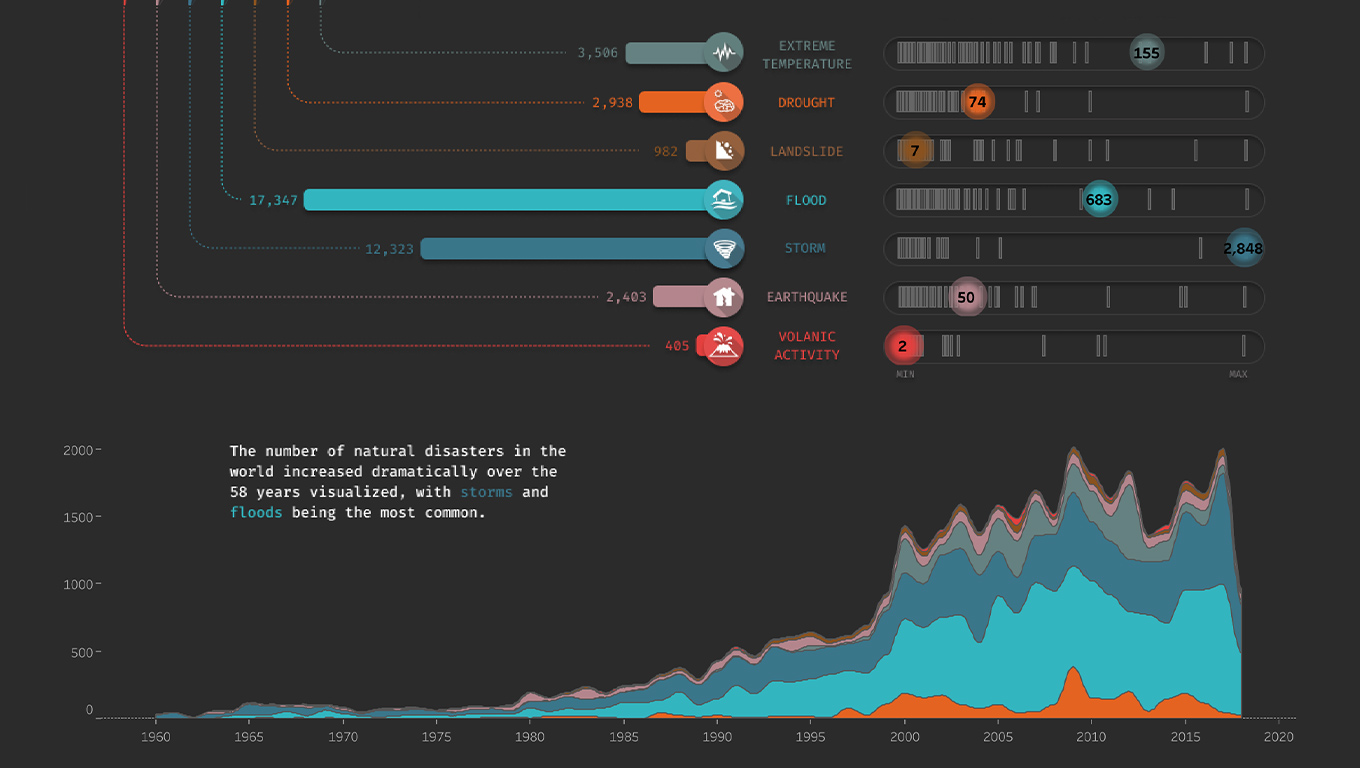
In the last 60 years, the world has seen a dramatic increase in the number of natural catastrophes. Dive into this #VOTD by George Gorczynski–based in Vancouver, British Columbia in Canada—to see the number, type, and which are most common ones per country. Favorite this viz
Congratulations to May’s inspiring data viz authors for their captivating visualizations. Don’t forget to log in to your Tableau Public profile and give them kudos by clicking on the 'Favorite' star icon in the top right corner of the viz home page. If you don’t already have a Tableau Public Profile, you can set one up for free.
Looking for more data viz inspiration? Make sure you’re subscribed to Viz of the Day. or browse around the Tableau Public Viz Gallery to see what’s currently on virtual display. You can even interact with the authors by leaving a comment, visiting their Tableau Public profile, or following them on social media.
See a newer viz you really love? Nominate it for an upcoming Viz of the Day! You never know. We might just feature it in the Viz of the Day Gallery.
相关故事

Meet Iron Viz 2024 Finalist Jessica Moon
 2024/04/15

Meet Iron Viz 2024 Finalist Pata Gogová
2024/04/08

Student to BI Analyst, How Tableau Can Lead to a Successful Data Career
 2024/03/20
Subscribe to our blog
在您的收件箱中获取最新的 Tableau 更新。