Here Are Our #DataResolutions. What Are Yours?


Happy new year, everyone, and welcome into 2017! We hope you are well-rested after a sweet holiday break.
The beginning of the year is often a time for reflection, introspection, and (re)organization. As a team, we are committed to helping you grow as Tableau Public authors and to bringing you an improved user experience on the Tableau Public website. But what about individual members of the team? What are our data artists' personal goals for 2017? Here they are, in their own words.
Sophie Sparkes: Start, Learn, Finish, Repeat
Every year, I promise myself that this will be THE YEAR; the year that I finally get my Python up to scratch; the year I really begin to master Tableau's JavaScript API; the year that I stop being intimidated by D3; the year I read my backlog of data-viz books. And every year, none of these things happen.
So for 2017, I think my resolution should be to actually try to do one (or possibly two) of my "annually recurring #DataResolutions!"
While I haven't decided which resolution I'll try to tackle, here are the things I think I'll need to do to be successful:
- Create an interesting project or viz where I'll need to use one of the coding languages to complete it successfully (I know I learn best when I'm working on something I find interesting, and also when I'm working on something that lets me practice what I'm learning)
- Give myself a deadline to finish the project/viz (without a deadline, I know I never start anything!)
- Tell people that I'm starting my project/viz, and also when I want to finish it by (this'll make me accountable!)
- Actually start my project/viz! (in the words of the great Samwise Gamgee from The Lord of the Rings, "It's the job that's never started as takes longest to finish."
I'm also hoping that I can share my learnings from whatever resolution I end up doing here, on the Tableau Public blog. Here's to 2017!
Ben Jones: Seek and Give Constructive Feedback
I feel that I’m very fortunate to be a part of a vibrant and talented community of data geeks. Over the past decade or so, I’ve been on the receiving end of some very helpful feedback, both in the form of plusses—things people liked about my work, as well as deltas—things people thought I could change to make my work even better.
So my new year’s resolution in 2017 is to take the art of constructive feedback to a whole new level going forward. That’s how I responded to Pooja Gandhi’s question just before 2016 ended:
@DrexelPooja @datachloe @tableau Great question! Mine is to both practice & promote constructive feedback within the #dataviz community.
— Ben Jones (@DataRemixed) December 30, 2016
How exactly am I going to do that? Two ways:
- First, I’ll proactively seek feedback from others on works in progress. Over email, in person, and on social media, asking, "How would you improve this?” at least once per week
- Second, I’ll put myself out there as someone who’s willing to give my $0.02 when others ask for input. Want to know my thoughts on your latest viz? Just ask me @DataRemixed!
Jenny Richards: Change Your World with Data
I spent all of last year (and a good part of the year before) building my data-viz skills, so when it came time for me to think about this year’s resolutions, I already knew the direction I wanted to go: my community.
One of the reasons I love Tableau is that it enables me to engage in my community in a way that I can see results. There are terrific hyperlocal efforts underway in our newsrooms, in our schools, and in our neighborhoods. I have a practical skill to volunteer, and this year I want to set a good example to other folks in the data-storytelling community of how they might use their skills for the benefit of their communities, and also highlight others who are doing the same. I’ll be sharing these stories and more on the Tableau Public blog this year.
You want to make a difference? Offer your time. That’s what I’m going to do. You want to share what you’re doing? Let me know on Twitter @jnnyrchrds or send me an email. You see something that you want to duplicate in your community? Reach out. Let’s find a way to make it work. Not sure where to start, but want to spitball ideas? Give me a shout.
Jade Le Van: Focus on Images and Calcs
I'm keeping my new year's resolutions simple this year. I'd like to use images better and become fluent in Tableau calcs.
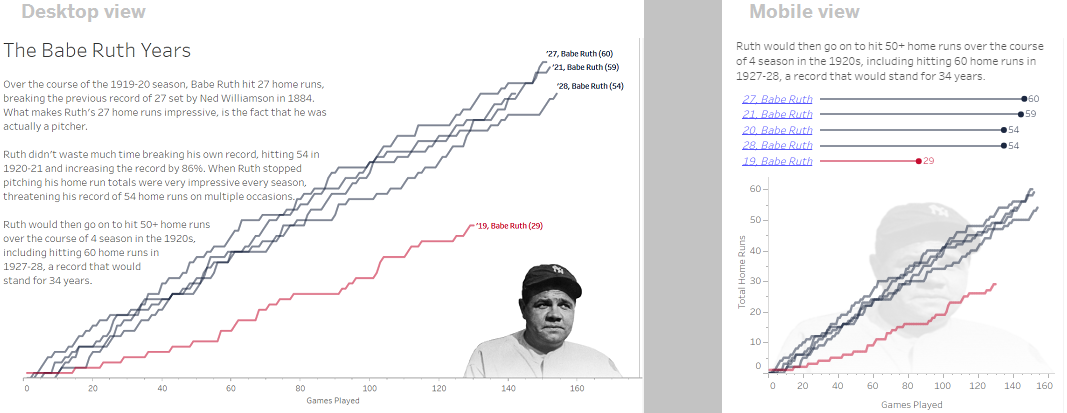
For the first resolution, I have my eyes on free image editor GIMP as well as good old Photoshop. Mastering these tools will help me create viz backgrounds, banners, and custom shapes. Not that a data viz must necessarily include images, but sometimes it does support the message and makes the visualization so much more vivid and memorable.
A good example, apart from Jonni Walker's incredible vizzes, is The History of the Single Season Home Run Record, winner of the third Iron Viz Feeder Contest in 2016. If you look at both the desktop and mobile version, you'll recognize that some image-editing skills have been put to good use here.
For the latter, I'll dig into available resources starting with the excellent content from the 2016 Tableau Conference in Austin, like Luca Bandini's "LODs of Fun with Level of Detail Calcs" session. And I will make a point of finding immediate application to the concepts so that it doesn't stay theoretical! Workout Wednesday will also help.
What Are Your Resolutions?
We'd love to learn about your new year's data resolutions! Use the comments section below or let us know on Twitter @tableaupublic using the hashtag #DataResolutions.
相关故事

Meet Iron Viz 2024 Finalist Jessica Moon
 2024/04/15

Meet Iron Viz 2024 Finalist Pata Gogová
2024/04/08

Student to BI Analyst, How Tableau Can Lead to a Successful Data Career
 2024/03/20
Subscribe to our blog
在您的收件箱中获取最新的 Tableau 更新。