Best of the Tableau Web: Sparking creativity and new ways of thinking
Hello, Tableau community! Welcome to Andy's May round-up of the best content being produced by you, the Tableau community.


Hello everyone, and welcome to my monthly round-up of what’s been happening on the Tableau blog scene. Thank you once again to everyone sharing ideas and content during these challenging times.
Last month, I talked about collaborations, specifically looking at individuals coming together to work on a single project. Of course, collaboration can manifest in many different ways, and this month, I’m looking at other ideas. Each of these examples might spark ideas to help you build your technical, creative, and analytical skills.
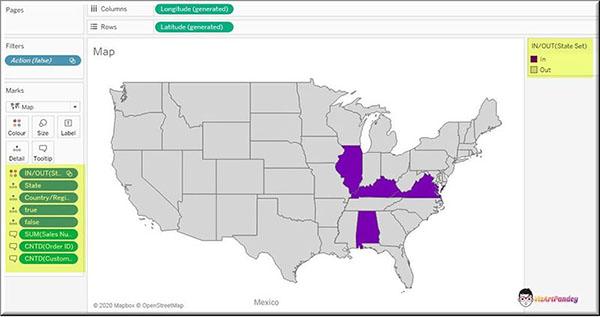
First of all, there are the flagship community projects: Workout Wednesday, Makeover Monday, Project Health Viz, Sport Viz Sunday, and more. Each of these will get you involved in a community of like-minded people who can help grow your skills. On top of that, each project and collaboration are opportunities to share your own learnings. I especially enjoy seeing explanation posts, such as Rajeev Panday’s description of a Workout Wednesday that used set actions. Solving the puzzle develops your skills, but working out how to explain a solution will develop them further.
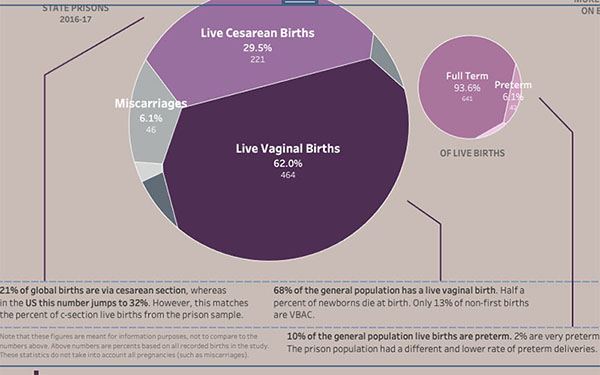
Another example is Linday Betzendahl’s design breakdown of her Iron Quest/Project Health Viz project. This one focuses on her use of layout containers. This reminds us that successful analytics is about the design just as much as it is about the technical power.
Finally, collaboration can mean doing ongoing work together. I want to highlight the Alphabet Project, run by Adam Green and Laura Sandford. Throughout the year, they go from A to Z, choosing a topic for each letter. May’s letter and project topic was J for Jewels (Adam, Laura) and K for King (Adam, Laura). These are somehow my favorite projects. They are ongoing and they introduce a constraint. Constraints force creativity—and this is clear in all the projects done so far.

I couldn’t focus on May’s blog, talk about creative endeavors, and not give a shout-out to Neil Richards. His solo project in May was to create a visualization every day (every day!) inspired by “Flood,” an album by the band, They Might Be Giants.
I hope those ideas give you inspiration. Finding creative outlets is a great way to get involved in the community. Adam, Laura, and Neil, in particular, indicate something very important: your project doesn’t have to be big, profound, or about mass participation. Sometimes, the simplest ideas can trigger great results.
As always, enjoy the list! Follow me on Twitter and LinkedIn as I try and share many of these throughout the month. Also, you can check out which blogs I am following here. If you don’t see yours on the list, you can add it here.
New bloggers added last month: Marian Eerens, Jiselle Howe, Nadine Gorr and Daniel Rowlands, DataDumpChat, Andrew Watson, Darragh Murray, Soha Elghany, and Evelina Judeikyte.
Tips and tricks
Sean Miller #WOW2020 | 21 | How to use device designer for mobile views in Tableau
Sijia Wei How to create Step Area Charts in Tableau?
Sarah Bartlett How to Use Annotations in Tableau
Spencer Baucke Top Five : Things I’ve Learned About Tableau Recently
Toan Hoang Tableau QT: Negative Space Area Charts
Heidi Kalbe Floating your objects like a pro
Spencer Baucke Tableau’s New Relationships and What They Mean
Rajeev Pandey WOW S04 E22: Spotlight Chart in Tableau
Janasobini Vetharuban #easierthanithought: Tableau Keyboard Shortcuts
Brandon Fitz-Gerald How to stop highlighting when selecting a mark. | Tableau Tip
Luke Stanke Six Uses for a Transparent Shape in Tableau
Micol Bedarida Commenting on a field – Tiny Tableau Tip
Brian Moore Building Better Dashboards Through Interactivity – #Vizconnect
Jisell Howe It’s the Little Things: Small Multiples Tutorial
Marian Eerens Spaghetti Lines for the Win (and How to Control the Size of Your Marks in Tableau) – My Dataviz Journey
Andrew Watson How to do sheet swapping in Tableau
Jim Dehner FAQ Series - Context filters - What do they really do?
Katrina Johnson How to LAG in Tableau Prep
Klaus Schulte Drill-Down & Up P&Ls in Tableau
Inspiration
Klaus Schulte A student’s guide to Tableau and the Desktop Specialist exam
Adam Green K is for King
Ken Flerlage Lego Art in Tableau
Andy Kriebel How to Get Your Data from Strava to Tableau
Jeff Plattner Tableau Public Revizited
Jeffrey Shaffer Bin There, Done That: A Discussion of Bins in Tableau
Judit Bekker Black Lives Matter
Darragh Murray First Tableau #IronQuest submission
Evelina Judeikyte Visualising Progress in Yoga Inversions
Formatting, design, and storytelling
Judit Bekker And Then Were None
Keith Dykstra Small Changes, Big Impact: Quick Tableau Dashboard Tips
Lindsay Betzendahl Creating Annotations Using a Show/Hide Container
Rajeev Pandey Stylising a Navigation Menu with Tableau
Spencer Baucke Dashboard Design Essentials: Dashboard Layout & Formatting
Judit Bekker Spicing up dashboard titles
Kevin Flerlage Create Maximize & Minimize Options in Tableau
Set and parameter actions
Rosario Gauna Parameter Actions for Add / Remove (Select / Deselect) Values
Lorna Brown #TableauTipTuesday 2020 Week 21: How to create combined sets
Pallavi Naik WOW S04 E20 : PROPORTIONAL BRUSHING USING SET ACTIONS
Andy Kriebel #TableauTipTuesday: How to Compare to a Selected Value with a Set Action
Marc Reid Creating Drill-Down Tables with Parameter Actions
Matthew Whiteley Using the New Set Controls Feature in Tableau 2020.2
Calculations
Alexander Mou Getting the Last Date/Value/Variance in Tableau
Erica Hughes Tableau String Calculation: FINDNTH( ) – Finding the position of a letter or sub-string within a longer string
Micol Bedarida Dynamic Date Level
Jim Dehner FAQ Series - Convert String Dates
Code
Bryant Howell Attribute-Based Row Level Security in Tableau, a Working Technique
Wiktoria Rudz Tableau server REST API requests analysis
相关故事

Meet Iron Viz 2024 Finalist Jessica Moon
 2024/04/15

DataFam Roundup: April 8–12, 2024
 2024/04/12

Meet Iron Viz 2024 Finalist Pata Gogová
2024/04/08
Subscribe to our blog
在您的收件箱中获取最新的 Tableau 更新。