Keep calm and hack on: Tableau's first EMEA hackathon


A few weeks ago, the Tableau Developer Platform team packed up their bags and flew to London to host our first ever European hackathon! We invited local customers and partners to participate in building dashboard extensions with the Extensions API, currently in preview in the pre-release portal.
The upcoming Extensions API feature allows you insert web applications directly into Tableau. These extensions offer two-way communication between your application and dashboard. This allows for some amazing things like new integrations with third-party systems, new visualization types, and even the ability to write back to your database.
We first unveiled the Extensions API at TC17 during our product keynote and opened our alpha builds to developers in a preview program. Since then, our team has released multiple updates with new features, like a new connection interface, context menu configuration, and web authoring. We couldn't wait to see what the eager hackers in London would come up with!
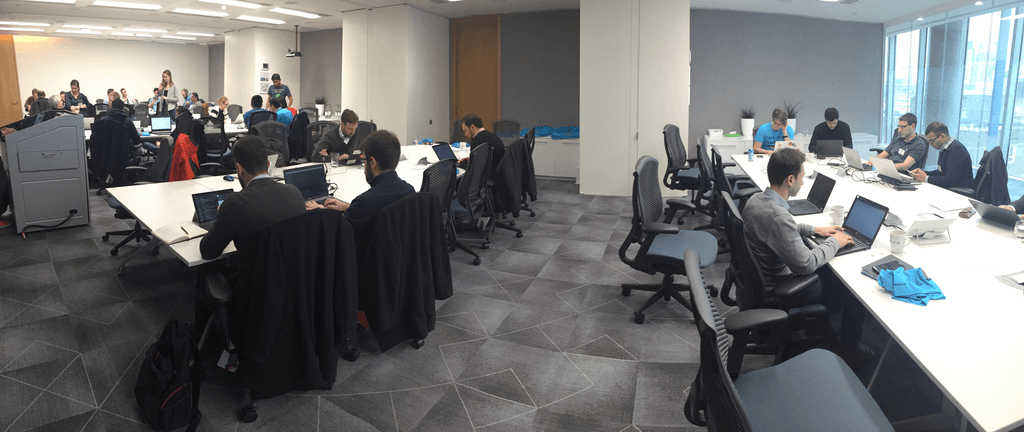
Hackers hard at work in our London office.
We brought members of our product, engineering, marketing, and design teams to mentor and participate. Even our internal presales team in London cranked out a few extensions of their own.

A Slack extension from Tableau’s presales team.
During the day we offered design sessions where developers could get feedback and advice on design best practices. Some of our attendees had limited coding knowledge but were still excited to work on their ideas. One attendee spent his day exploring new possibilities and learned how the Extensions API can potentially help him with his PhD analysis. He commented, "I'm not a developer, but the Extensions API has inspired me to start learning JavaScript."
After a long day of hacking, a dozen groups demoed their dashboard extensions—a few even showed multiple extensions! Our hackers shared additional ideas for ways they plan to use the Extensions API to build new integrations directly in Tableau.
Here are some quick highlights from the teams at the event:
- ACS International Schools: Integrate student achievement tracking and planning with Google forms
- Biztory: Filter dashboards from a series of images that are based on your data; set a dynamic default date value for a parameter that updates automatically
- The Information Lab: Upload server log files and pipe them through a workflow in the Alteryx gallery
- K4 Analytics: Manipulate your data in an Excel-like table that can run calculations and write back to your database
- Royal Bank of Canada: Display a D3 tree diagram directly in your dashboard; show zeroes when there is no data instead of showing a blank worksheet and send an email to admin for questions about dashboard
- Sparks: Show data points on Google Maps based on user selection
- Starschema: View updating statistics based on underlying data and selections
- Steven Zhang, PhD Student at Loughborough University: Visualize Tableau polygons on Google Maps as satellite or street view
- Xpand IT: Add or update data fields and data that is written back to your data source as well as updated in Tableau
- Tableau: Export high-resolution images and data to Word, Excel, and PowerPoint; post a snapshot of your dashboard to Slack; display Instagram photos based on filtering selection; create dropdown parameters that automatically update with the latest data
Want to watch all the demos? View them here.
You can watch videos of each of these demos—or join the program yourself—from the Extensions API Developer Preview site. See what these groups in London accomplished and get some inspiration to start building your own dashboard extensions, or learn more about Tableau's capabilities for developers.
相关故事

How Team USA uses data to build a digital HQ
 2022/02/08

Data trends that will impact you in 2022

Healthcare Analytics Hub Starter Kit: Get the data you need faster
 2019/10/18
The purpose of the Healthcare Analytics Hub Starter Kit is to provide a sample of what your healthcare app could look like. It’s not a complete solution; instead, it’s focused on what’s possible. Please contact your Tableau Account Manager to get started today!
Subscribe to our blog
在您的收件箱中获取最新的 Tableau 更新。