Why use Tableau Data Extracts
This is part two in a three-part series about Tableau Data Extracts. In the first post, we looked at how Tableau Data Extracts are built and used by Tableau. If the content of the first post did not already sell you on the benefits of TDEs, then here are several reasons that Tableau Data Extracts (TDEs) are valuable—even essential—to Tableau users:


Note: This is the second installment in our series. View the first and third installment to learn more about Tableau data extracts.
In the first post, we looked at how Tableau Data Extracts are built and used by Tableau. If the content of the first post did not already sell you on the benefits of TDEs, then here are several reasons that Tableau Data Extracts (TDEs) are valuable—even essential—to Tableau users:
7 reasons for using Tableau Data Extracts:
- Performance
Data extraction not only offers increased performance when the underlying data source is unacceptably slow, but it also can speed up the performance when the use of CustomSQL slows it down (see here).
- Reduced load
Replacing a live connection to an OLTP database—or any database—with a TDE reduces the load on the database that can result from heavy Tableau user traffic.
- Portability
A TDE can be bundled with Tableau visualizations in a packaged workbook for easy sharing and collaboration.
- Pre-aggregations
When creating a TDE, Tableau gives you the option to aggregate your data for all visible dimensions. This is known as an aggregated extract. An aggregated extract is smaller and contains only aggregated data, as the name implies—not all of the row-level data that is stored in a standard TDE. Accessing the values for additive aggregations in a visualization becomes near-instantaneous because all of the work to derive the values has already been done. So, the most basic reason to use an aggregated extract is performance.
You can also choose to roll the aggregations up to the selected level—e.g. month, quarter, year, etc. —of one of the date fields in the underlying data source. This further reduces the size of the extract by reducing number of aggregate values stored in the extract, and for that particular level of aggregation, further increases performance. For more information, check out the following articles here and here.
- Materialization of calculated fields
When you optimize a Tableau extract, all of the calculated fields that have been defined are converted to static values upon the next full refresh. At that point, they essentially become additional data fields that can be accessed and aggregated as quickly as any other field in the TDE. The increase in performance can be especially strong when working with string calculations as string calculations are significantly slower than numeric and/or date calculations. So, as was the case with aggregated extracts, the most basic reason to optimize a TDE is again performance.
- Publishing to Tableau Public and Tableau Online
Tableau Public only supports TDEs. While Tableau Online can connect live to cloud-based data sources, TDEs are the most common data source used in that environment.
- Support for functionality not available when using MS Jet
Versions 8.1 and earlier of Tableau use the MS Jet engine for accessing Excel, MS Access and text files. By creating an extract, certain features not supported by Jet—count distinct, for example—can be used. (In version 8.2, Tableau replaced MS Jet for accessing Excel and text files with a new, more performant and functional engine.)
Example use cases
Representing all of the possible use cases for TDEs would not be possible in a blog post as short as this one. What follows is meant to give the reader a sense of the unique kinds of things that can be done with TDEs to extend the functionality of Tableau.
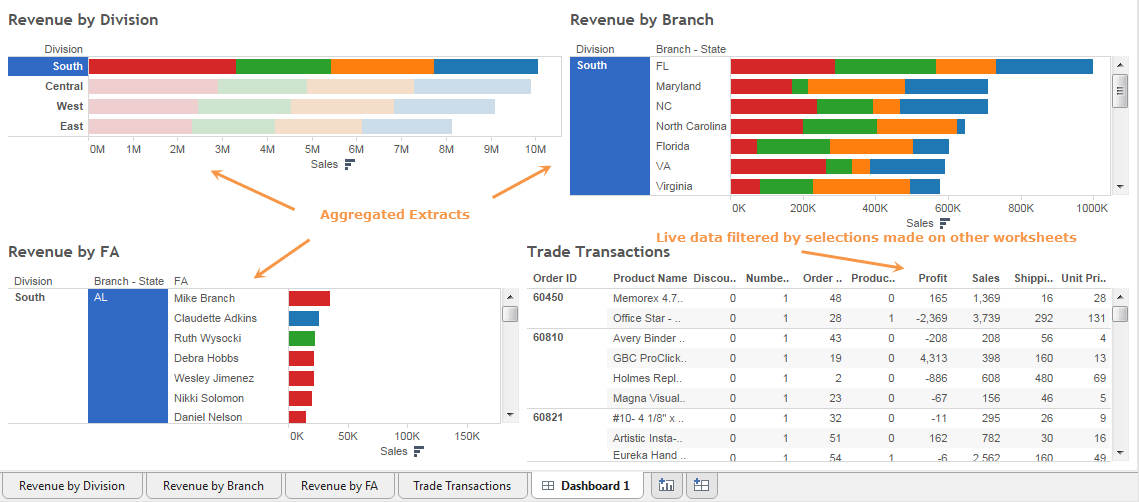
Fig. 1 A dashboard that combines aggregated extracts and live connections for ease of navigation and performance
Hopefully this post has given you an even better sense of how and why Tableau Data Extracts can help you use Tableau to see and understand your data. Next week, we’ll wrap up the series with an extensive list of tips, tricks and best practices.
- Compare an aggregate for all rows in an underlying source with the same aggregate for a subset of the rows. By blending a data source with an aggregated extract based on the same data source, you can filter and slice data to compare aggregations of the subset to the entire data set (this can also be done using RAW SQL functions or Custom SQL).
- Create “double aggregates.” For instance, if the default aggregate for a measure is SUM, creating a pre-aggregated extract would allow you to calculate an AVG of SUMs in the visualization.
- Build a KPI-style dashboard that combines worksheets based on aggregated extracts with worksheets based on live connections. This design pattern has performance advantages in that KPI-style aggregations are pre-calculated and do not require a live connection, reducing the load on the underlying data source(s). By the way, here’s a nice article from this same blog about KPIs.
相关故事

How Team USA uses data to build a digital HQ
 2022/02/08

Data trends that will impact you in 2022

Healthcare Analytics Hub Starter Kit: Get the data you need faster
 2019/10/18
The purpose of the Healthcare Analytics Hub Starter Kit is to provide a sample of what your healthcare app could look like. It’s not a complete solution; instead, it’s focused on what’s possible. Please contact your Tableau Account Manager to get started today!
Subscribe to our blog
在您的收件箱中获取最新的 Tableau 更新。