From concept to coding, from deployment to support, the high-tech industry is a numbers game, with the potential to generate vast amounts of data. Tableau makes that information useful, helping you speed up time-to-market, improve user experiences, and build on success. With fast performance and intuitive visualizations, you can explore and understand high volumes of data in minutes—whether it’s a website clickstream or an infrastructure event log. Explore patterns that emerge from thousands or millions of users, understand product trends, and even embed Tableau inside applications to differentiate your offerings.
Solutions
High Technology Analytics
How High Technology companies use Tableau
Lenovo increases reporting efficiency by 95% across the enterprise
With Tableau, Lenovo’s Analytics BI & Visualization team created a flexible sales dashboard that departments can adapt for ad-hoc analyses, leading to a 95% improvement in efficiency across 28 countries.
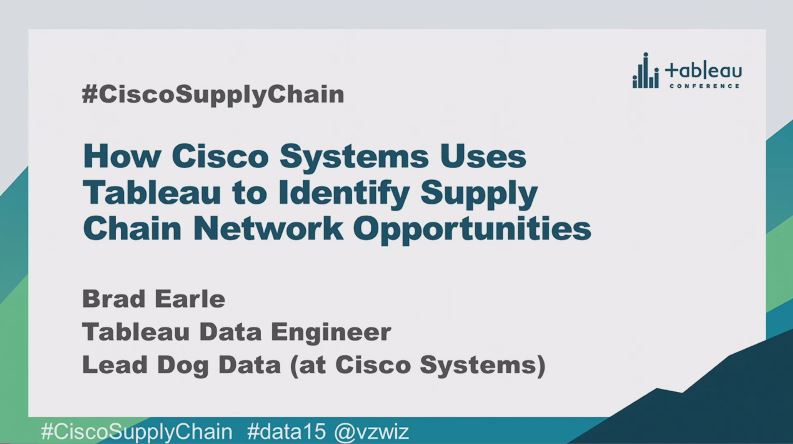
How Cisco Systems uses Tableau to identify supply chain network opportunities
Working with over 14,000 items in Tableau, Cisco is able to evaluate Product Demand Variability, align distribution centers with customers, evaluate the location and spend within the supply chain and illustrate the flow of goods through the SC network. Cisco Systems will focus on the Supply Chain department's use of Tableau, particularly in the balancing of a complex network of suppliers to the end customer in order to manage inventory and reduce the order-to-ship cycle.
Watch NowWhen we first started with Tableau, we were just thinking about dashboarding and reporting. We never thought Tableau would fundamentally change the DNA of the organization. It’s not just about a solution or a technology, it’s about how the culture towards data has changed.
Storage providers and skunkworks analytics
Seagate innovates by putting data in the hands of business users
As a leading data storage provider, Seagate creates space for the human experience by innovating how data is stored, shared and used. Seagate's culture of innovation is all around bringing inventions that have never existed before. Seagate is empowering their employees and enabling them to apply data to questions at hand to continue to innovate and push the envelope.
Watch NowThe Circuit for Communications, Media, & Technology
The Circuit is a video learning series for the analytical needs of those in our Communications, Media, & Technology community. Whether you're a current customer, analyst, business unit, or new to Tableau, we have a variety of sessions to help you throughout your analytics journey.
Go to The CircuitIntel: How a new analytics team went from DOA to #winning with Tableau
It is late 2014, a new analytics team is assembled and start to evaluate the toolsets that are available. And what do they find? Duct tape and chewing gum holding things together—or the analytical equivalent, anyways—Microsoft BI. Unfortunately, no amount of PowerPivot running on SharePoint would save the day and a year was wasted with no way of providing insight to 50+ site managers across the globe about their 100K employees. Learn how without any IT support this analytics team finally found a real solution with Tableau.
Watch NowWe totally fell in love with Tableau and the promises that you have to offer actionable, readily available data that everybody can consume, not only the analyst and the power users, but everybody in an organization.
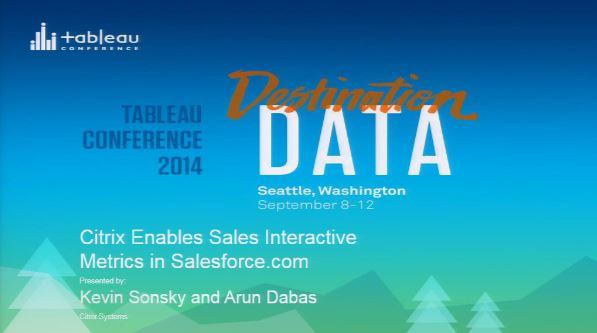
Citrix enables Sales interactive metrics in Salesforce.com
Citrix salespeople live and breathe inside Salesforce.com, their CRM in the cloud. But much of their data and metrics don’t. Years of investments building warehouses and databases to integrate data from multiple source systems...now how does Citrix get that to the decision makers in the field? With Tableau, Citrix is able to build those interactive dashboards and reports and embed any views they want right inside of Salesforce.com.
Watch Now
