Solutions

Impact Reports

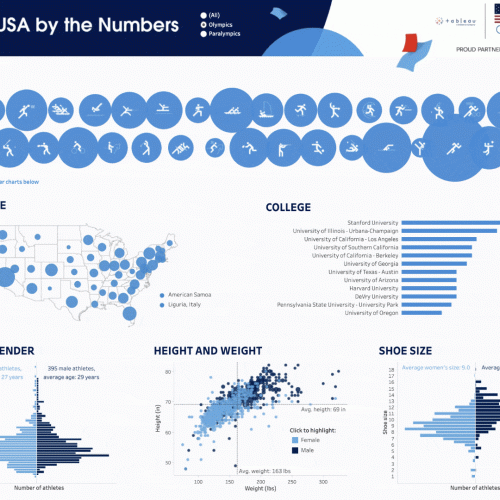
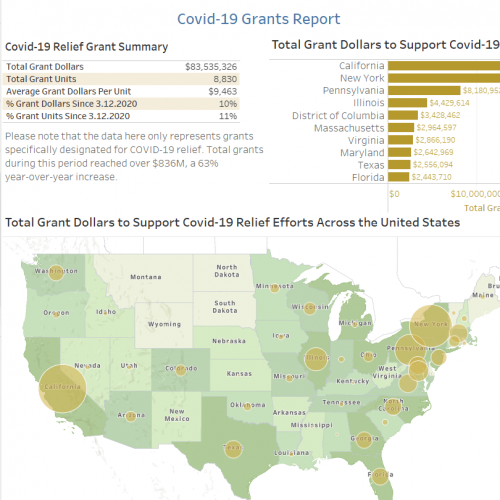
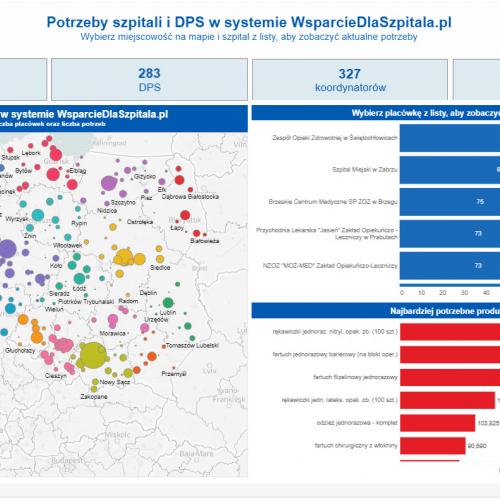
Non-profits need to show results to communicate the effectiveness of their programs and keep donors engaged. But they also cost hundreds of hours of staff time and thousands of dollars to produce.

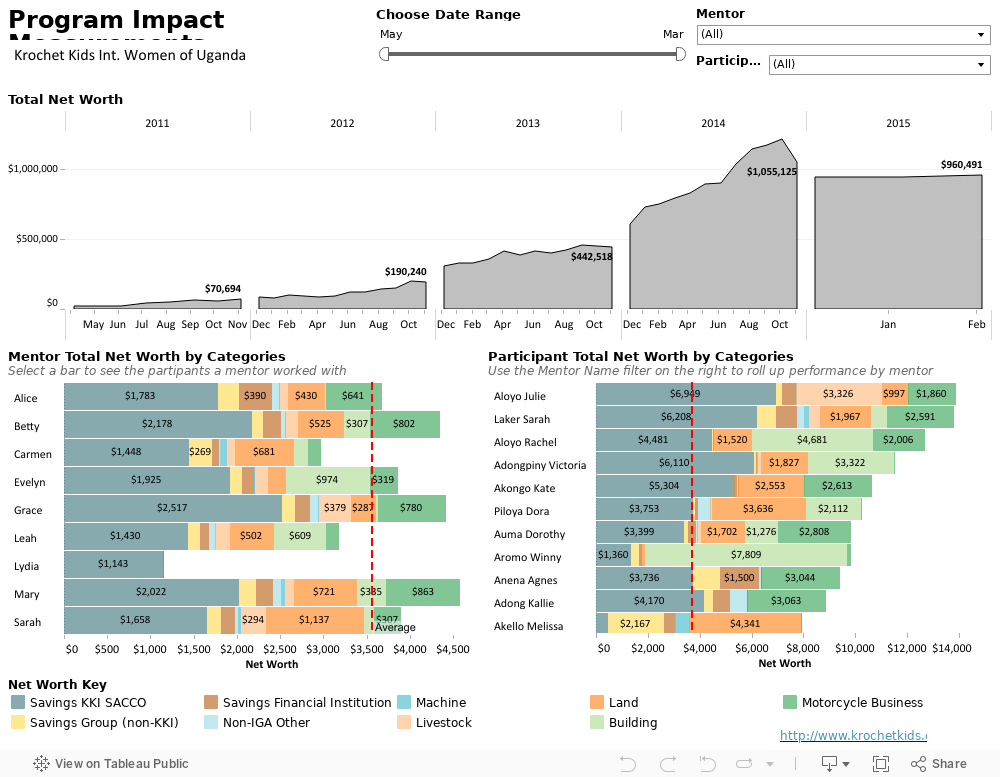
Building reports in Tableau allows you to communicate more efficiently and partner more effectively. In a matter of seconds, your data can tell the story of the difference your organization is making in the world.

Showing the difference

Krochet Kids wasn't satisfied just telling the world that their business is doing good--they wanted to show it.

That's why they turned to Tableau to visualize their 'Empowerment Score,' a collection of 45 wellbeing indicators that measure the progress of every KK intl. seamstress in Uganda and Peru.

See More


A new level of transparency

The Tableau Foundation's Living Annual Report shows you what we’re up to this week—not just what we did last year. Updating weekly, allows anyone to interact with the data and ask follow-up questions.

Share the latest information and cut the time and costs of producing a traditional printed piece.

Explore the Report


A storyteller's best friend

Tableau Public

Tableau Public is a free service that lets anyone publish interactive data visualizations to the web. Vizzes on Tableau Public can be embedded into web pages and blogs, shared via social media or email, and be made available for download to other users.

Go to Tableau Public