DataFam Roundup: May 31 - June 4, 2021


Dig into the latest DataFam Roundup—a weekly blog that brings together community content all in one post. As always, we invite you to send us your content—and the DataFam content from your peers that have inspired you! Find the content submission form here.
Celebrating Pride Month
Pride Month is a celebration of the impact that the LGBTQ+ community has had on making this world a better place. We are thrilled to be launching a new Pride exhibition in the Tableau Public Viz Gallery during the month of June - we hope you’ll take the time to explore the gallery and walk away feeling like you learned something new. Check out all the featured authors in this exhibit here.
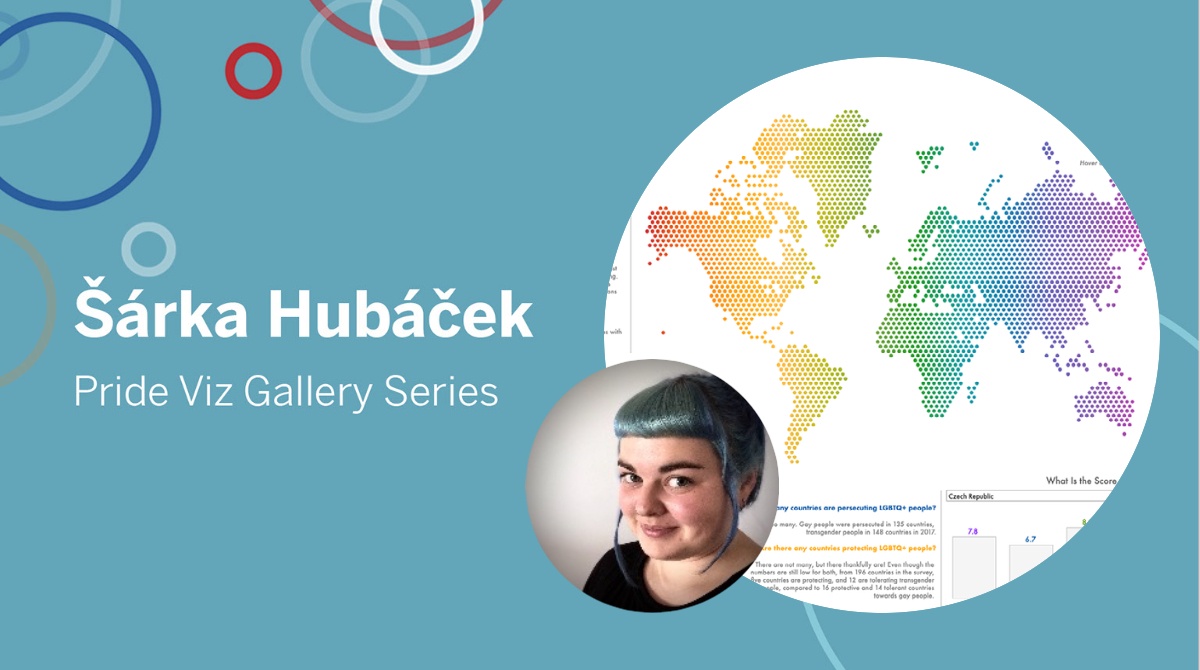
Learn more about Šárka Hubáček, her visualization ‘Love is love: LGBTQ+ rights around the world’ and her experiences with the Tableau Community in this featured blog post.
DataFam content

How to embed transparent Tableau visualizations into portals and apps. Should I do it? Alex Eskinasy
Dive into content created by the Tableau Community:
- How to Show and Hide Underlying Data with a Set Action Andy Kriebel
- My Viz-ion of Tableau’s Future: Salesforce’s Impact on the Brand, Community, and Product Application Adam Mico
- Famous illusions from the 20th century Soumitra Godbole (Tableau Community Forums blog—site login required to view)
- What’s Good? Learning Tableau: The Unconventional Way with Olushola Olojo. (June) CJ Mayes
- Pause and unpause Tableau extract refresh tasks: DataDev hackathon complete walkthrough Elliott Stam
- Writing Millions of Tableau CRM Data Rows Back to Salesforce Object Made Easy with Salesforce Asynchronous Processing Paul Liu
- See it your way... Jim Dehner
- Creating a dot-dash-plot in Tableau Marc Reid
- Bowing out of #MakeoverMonday Eva Murray
- Beauty of UI-based Faceting! Sayantani Mitra
- データ可視化の勘どころを掴むために (How to get the hang of Data Visualisation) Yoshitaka Arakawa (Japanese)
- How to embed transparent Tableau visualizations into portals and apps. Should I do it? Alex Eskinasy
- How I Pivoted from Engineering to Data Analytics in 8 Months Jessica Uwoghiren
- Tableau Community Forums June Survey
- Ambassadors Program feedback: new leader seeks input (Community Hub Blog)
Upcoming events
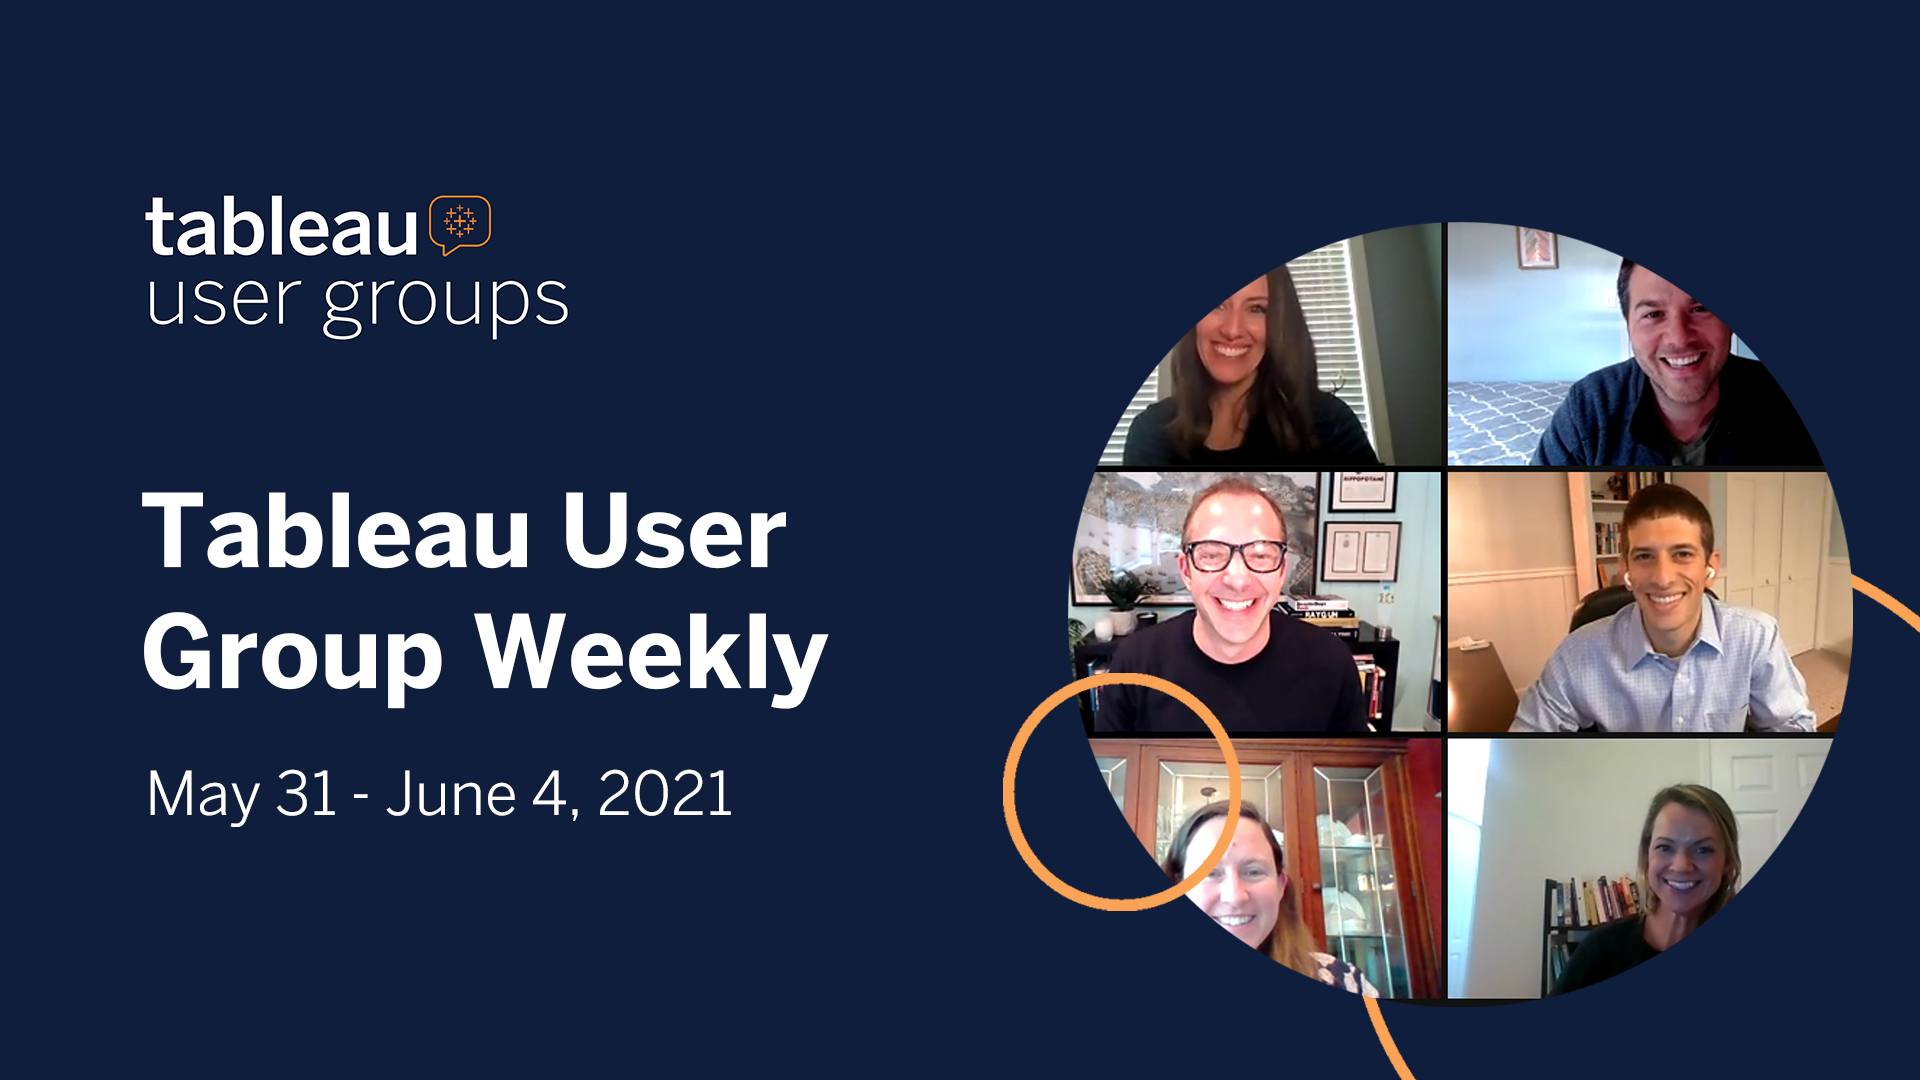
Tableau User Group Weekly: May 31 - June 4, 2021 featuring the "Super" Tableau User Group
Check out all the virtual Tableau User Group events here and catch up on this past week's Tableau User Group Weekly: May 31 - June 4, 2021—a new weekly blog series highlighting the latest Tableau User Group events around the world.
- Viz Feedback Office Hours Wednesdays Sign up to meet with Michelle Frayman and Zak Geis and discuss your content.
- Data Science for Everyone Commitments Event Tableau Tableau Senior Academic Program Manager Jessica Lyons will be joined by other keynote speakers to discuss the importance of increasing access and quality of data science in elementary and secondary schools.
Vizzes
Catch this week’s Viz of the Days here and subscribe to get them emailed directly to your inbox.
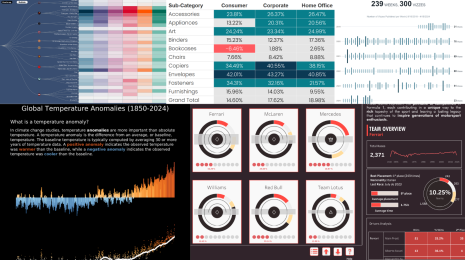
Check out some inspirational vizzes created by the community:
- Boy Bands Priyanka Dobhal
-
House Price in Seoul (ENG) Noel Myung
-
How to embed a GIF file in Tableau Dashboard? Avinash Reddy Munnangi
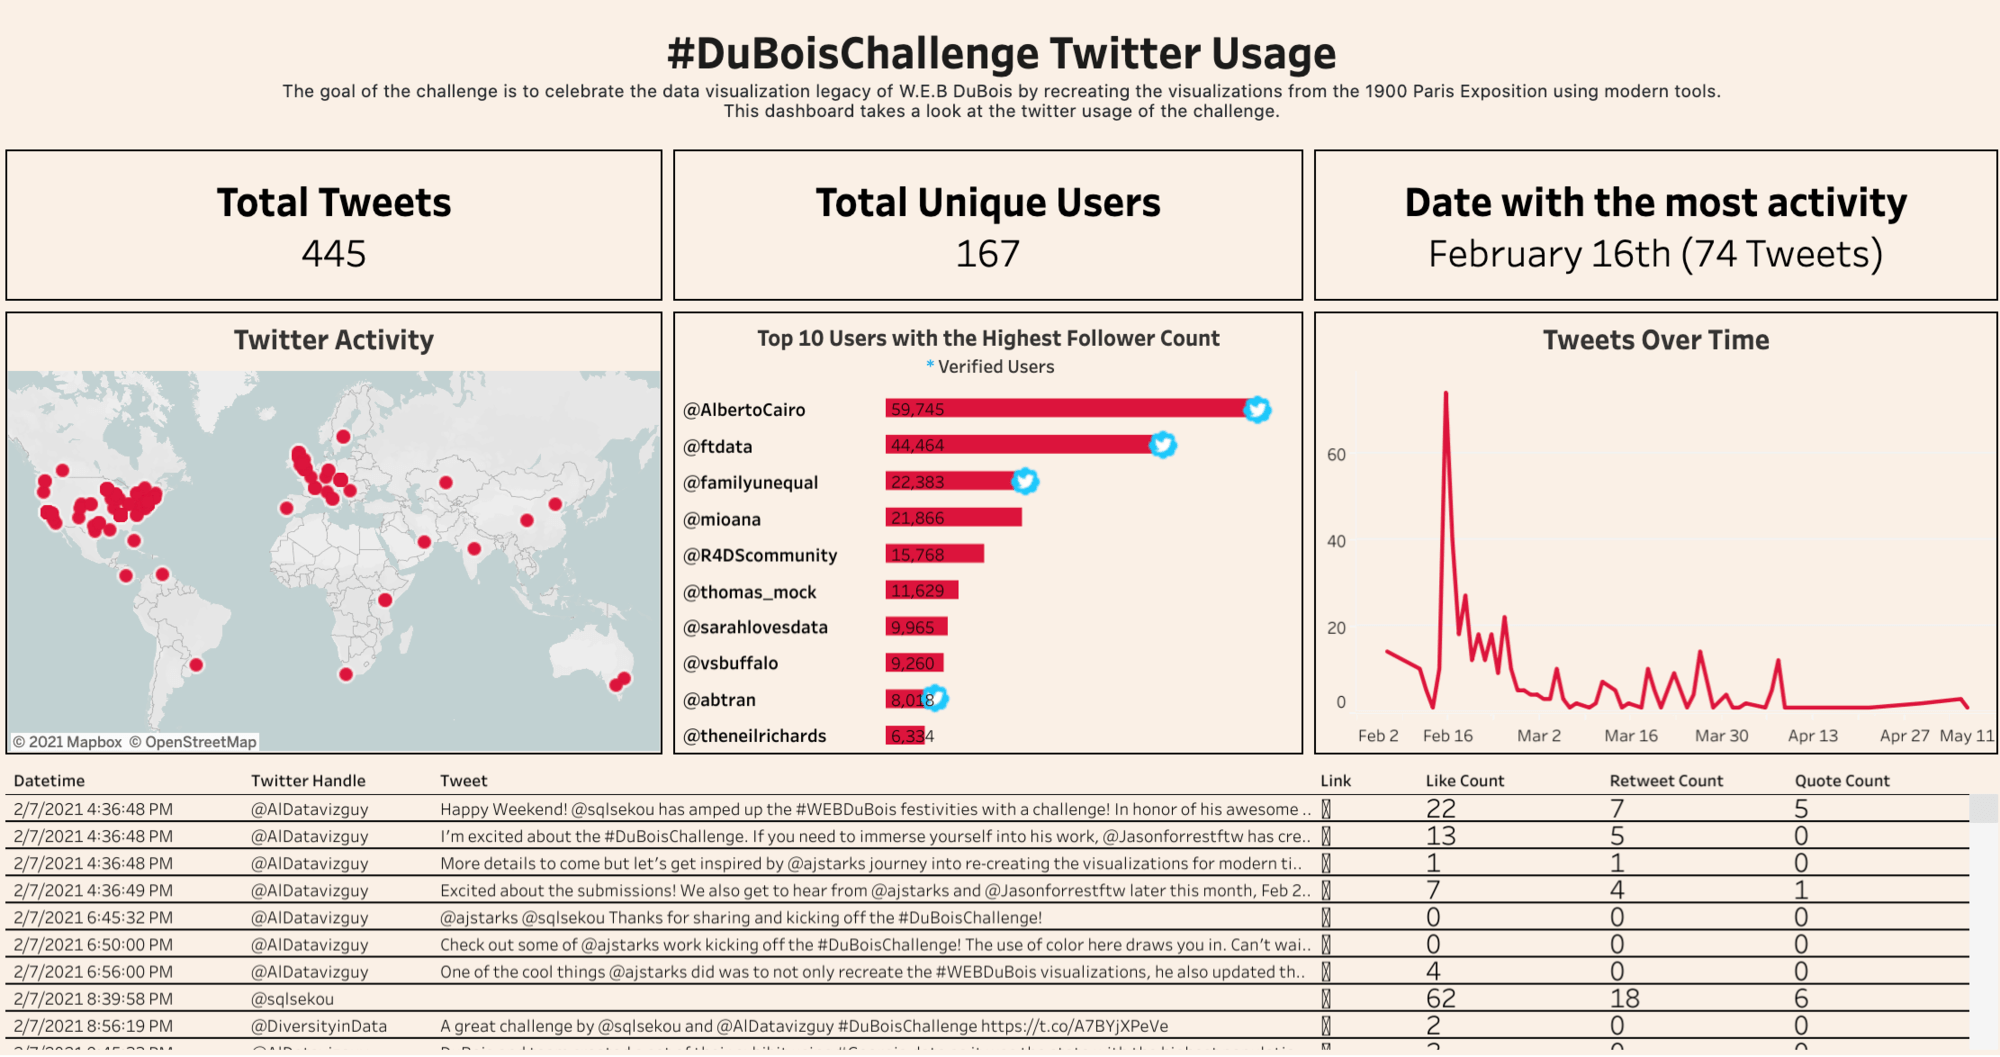
- #DuBoisChalllenge 2021 Twitter Metrics Sekou Tyler
- Zhou Shen: A Discography Joy Voon
-
Mapping the Trees of London Eve Thomas
-
Make-up kit for Tableau Ivett Kovács, Gyula Laszlo, Soma Osvay
Community Project Updates
Stay in the loop on the Tableau Community Projects

Relaterade berättelser
DataFam Roundup: April 15–19, 2024
 19 April, 2024

DataFam Roundup: April 8–12, 2024
12 April, 2024
DataFam Roundup: April 1–5, 2024
5 April, 2024
Subscribe to our blog
Få de senaste Tableau-uppdateringarna i din inbox.