How Feeding America Is Using Data to 'Get People to Start Asking Questions'


Back in April, Feeding America Southwest Virginia’s IT/Data Director Erich Geist found himself in a local church, having a conversation about data systems and, well, milk.
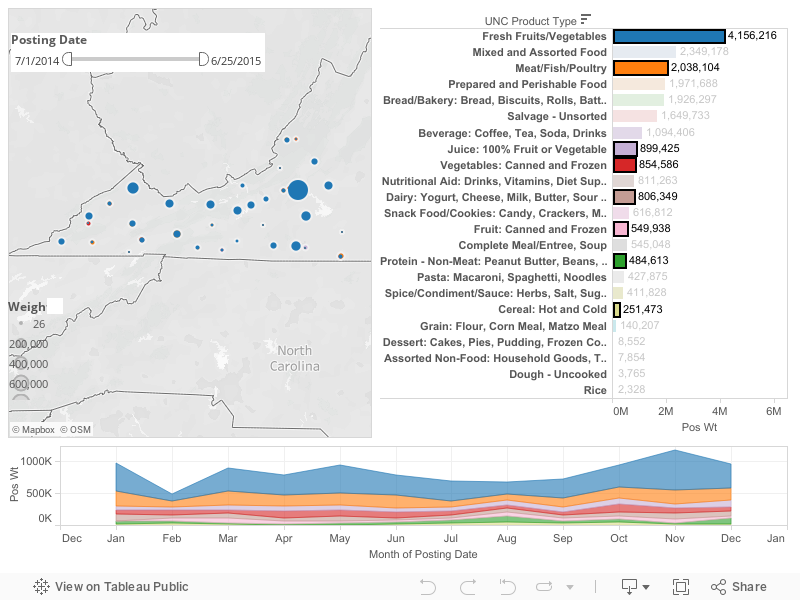
A convening of area partner food pantries, programs, and FASWVA staff at the April Roanoke Partner Conference was a chance for Erich to present the new Online Marketplace tools for agencies participating in the Partner Pick-up Program.
Sourcing food from manufacturers, growers, retailers, and caterers, the program helps Feeding America food banks close the meal gap and meet the needs of their communities.
Feeding America estimates that approximately eight billion meals are required each year to support every food insecure household in the country. Today, the organization’s network of 200 food banks and 61,000 food pantries, soup kitchens, and other agencies have enough food to serve just three billion of those meals.
Programs like the Partner Pick-up were designed to help make up the difference but require local knowledge and relationships to be successful.
Several agencies told Erich they felt the amount of dairy items they were receiving from area Food Lion grocery stores was decreasing. So Erich and his assistant, Peter Hamner, looked to the data.
“We popped the Food Lion contribution data into Tableau and, sure enough, we could see the downward trend or no distribution in some locations,” said Erich.
It so happened that a Food Lion regional manager was scheduled to tour a FASWVA facility, and the staff took the opportunity to show him the chart.
“After the meeting, the regional manager went back to stores and, all of a sudden, dairy contributions started picking back up,” Erich said.
Erich noted that the reduction hadn’t been a conscious decision, but the data served as a conversation starter with individual store managers about best practices. The Food Lion regional manager also requested monthly reports to make sure the grocery chain is making the most of its community support.
Erich says data has proven instrumental in managing relationships with the various local Food Lion stores, and Peter has replicated that approach with other major donors like Kroger, Walmart, and Sam’s Club.
This visualization shows what each of those partners donates to the FASWVA each month.
In addition to the Partner Pick-up data, Erich and Peter spend much of their time on data projects for the fundraising and communications teams to help reach FASWVA’s constituents—volunteers, funders, local policymakers, and clients.
This requires presenting information in a way that is both comprehensive and easily understandable. And that’s where the data visualizations come in, says Erich.
For example, shortly after the Partner Conference, Erich took Feeding America’s national "map the meal gap" concept and localized it. The map helps people see the scope of the need in the area.
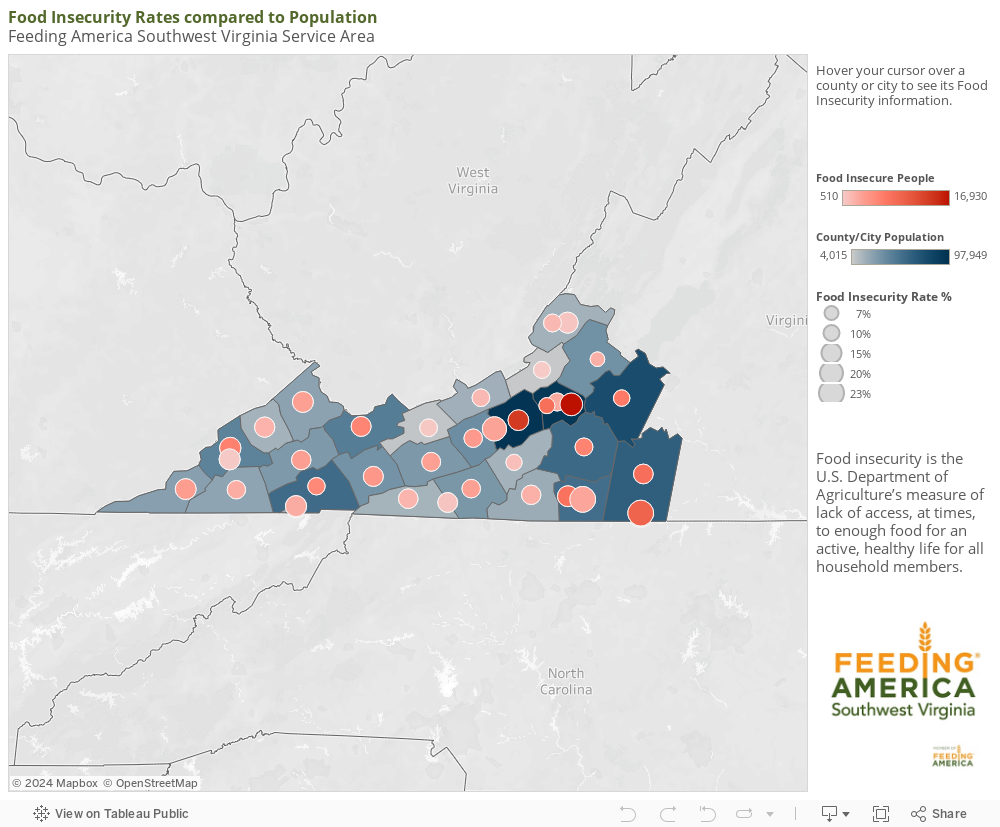
“I hope that anyone that looks at the map can see that food insecurity is pretty intense in our region,” he said.
The viz also helped convey some surprising insights, says Erich. The high food insecurity rates (as shown by the bubble size) in the higher populated areas around Roanoke and Montgomery were somewhat expected. But many are surprised to see that the food insecurity rates in the lower populated counties on the state’s western border are on par with the bigger cities, Erich says.
“The whole point is to get people to start asking questions,” he said. “The map itself causes people to ask hard questions about ‘why’ and reach out to see how they can help.”
Know of an organization using data to change the world? Tell us in the comments below.
Relaterade berättelser

Meet Iron Viz 2024 Finalist Jessica Moon
 15 April, 2024

Meet Iron Viz 2024 Finalist Pata Gogová
8 April, 2024

Student to BI Analyst, How Tableau Can Lead to a Successful Data Career
 20 Mars, 2024
Subscribe to our blog
Få de senaste Tableau-uppdateringarna i din inbox.