Best of Tableau Web: August 2022

Hi DataFam! I’m Caroline Yam, Tableau Community Manager based down under in Sydney, Australia, and I’m thrilled to join the ranks of the Best of Tableau Web authors.
During my four years with Tableau, I’ve had the privilege to engage with amazing people who gave the gift of content, from beginner to advanced—spanning blogs, videos, Tweets, podcasts, and more.
What better way to connect with others than by sharing your story or knowledge? Some people tell me they aspire to share, but they’re too shy or intimidated. But here’s the thing: No matter your story, your background, or where you’re at in your journey, what you put out there will help someone—even if that someone is you.
It’s never too late or too early to start putting yourself out there. Your story is unique and so is your perspective. You never know who you may inspire along the way (or even catch the eyes of a hiring manager). In our digital world, we have the opportunity to spotlight and connect people globally. Why not let that be you?
Digital has broken barriers in how we connect and helped even out the playing field for creators. No matter your location, race, gender, sexual orientation, ability, physical appearance, religion, age, or neurodiversity, you can have a platform online. There’s a real opportunity to amplify diverse voices and perspectives through our stories, blogs, and content.
Take Kimly Scott, for example. The Iron Viz finalist and fellow Aussie has been in the Tableau Community for a few years, yet only just recently started the She Will Viz blog focused on raising women’s voices in data visualization.

Image: She Will Viz
There’s also Datasaber, a thriving, community-led learning program in Japan founded by Tableau Visionary, KT, complete with a curriculum, mentors, and assignments. To finish the program, participants are asked to share their Tableau knowledge to benefit the broader community and themselves. After all, what better way to test your skills than explaining a technique to others? Yuko, from the Tableau Data Heroines group, and Tableau Niisan demonstrate this beautifully.
If writing isn’t your forte, give video a whirl. For example, Gaia Pometto, in the Netherlands, offers Down to Earth Tableau Tips and Marcelo Has, in Brazil, shares Tableau tips for Portuguese speakers. Or go quick and snappy, like Ethan Lang and Maggy Muellner’s #WeeklyTableauTips on Twitter.
All this to say: Just start. It can be as small as posting on LinkedIn, setting up a WordPress site, or hitting a record on your screenshare. I promise you, the DataFam can’t wait to see what you put out there and learn from you. To connect with the Community, tag your posts with the #DataFam, and I invite you to add it here to be featured in a future edition of Best of Tableau Web.
Now, enjoy these tips, tricks, inspiration, and more from the Tableau Community—the best data community in the world.
Calculations
- Calendar in Tableau
Annabelle Rincon, Rativiz
- Creating an Interactive Calendar in Tableau
Lucas Reinhard, Biztory
- How to Create a Two-Level Drill Down in Tableau
Andy Kriebel, VizWiz
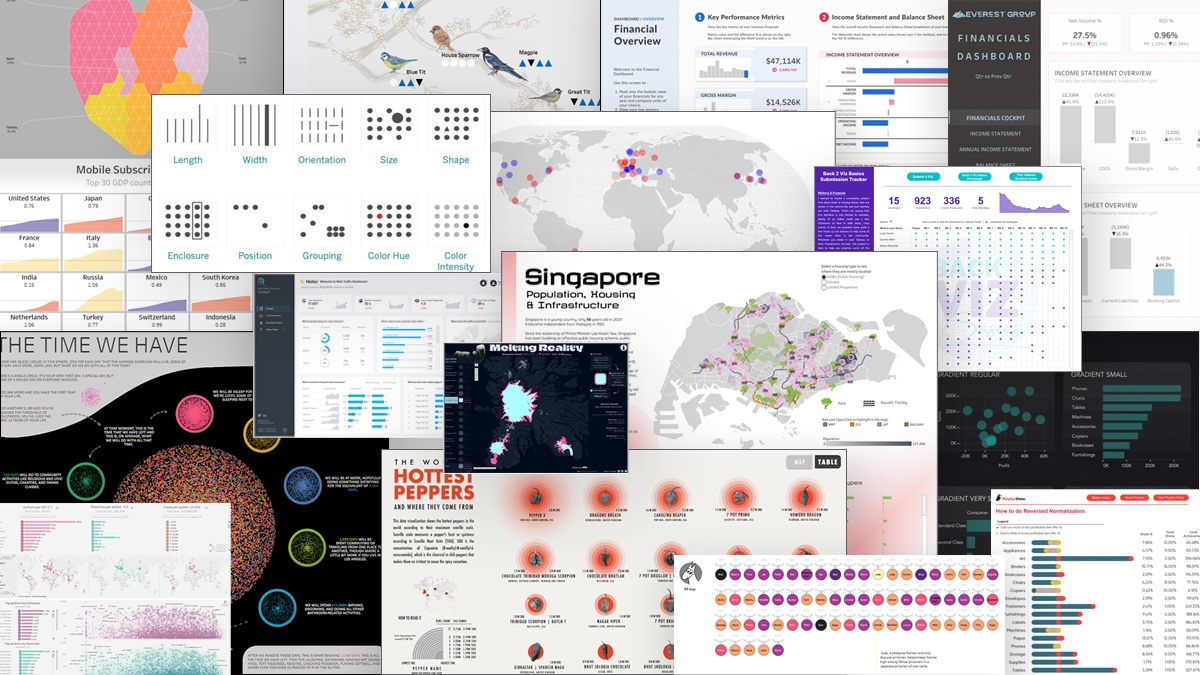
- How to do Reverse Normalization in Tableau
Maggy Muellner, Playfair Data
- ATTR - The Most Confusing Aggregation in Tableau
Andy Kriebel, VizWiz
- Charting "Top N and Others" via Table Calculations in Tableau
Alexander Mou, Vizible Difference
Formatting, Design, Storytelling
- What is Clustering in Tableau?
Dawn Harrington, Tech Tips Girl
- Analyzing Seasonality with Cycle Plots
Andy Kriebel, VizWiz
- Drawing Line Charts without Axis Offset in Tableau
Alexander Mou, Vizible Difference
- Spaghetti Charts Suggested Alternative: A Trellis Chart
Nir Smilga
- Pre attentive attributes: the key to catching the eye
Stepehen Hughes, The Data School Australia
- Robinson Projection in Tableau
Brian Moore, Do Mo(o)re with Data
Inspiration
- How to Create Shape Layers in Tableau
Yash Sakhuja, VizArtPandey
- What is Modular Information Design?
Neil Richards, Questions in Dataviz
- Iron Quest Nostalgic Games – Recap
Sarah Bartlett, Sarah Loves Data
- A 7-step Guide to a Tableau Interactive Resume
Thanh Ho, The Data School Australia
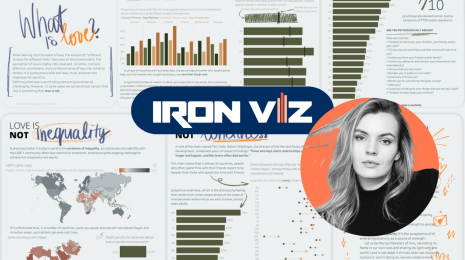
- Viz about what you love
Annabelle Rincon, Rativiz
- VOTD - How to get Viz of the Day
Kevin Flerlage, The Flerlage Twins
- Introducing TabCSS, Your Shortcut to Styled Backgrounds in Tableau
Rody Zakovich, Starschema
- My Tableau vizzes of the day recap
Nir Smilga
- Real World Fake Data – Season 2 – Financial Reporting Recap
Jacqui Moore, Guest blog on Sons of Heirarchies
- Ten Tips & Techniques: Round 5
Kevin Flerlage, The Flerlage Twins
- Data Viz lessons I learned in art school
Jacqui Moore, Do M(ore) with Data
- What’s Good? How To Elevate Tableau Learning At All Skill Levels – Eric Balash. (August)
CJ Mayes and Eric Balash
Prep
- Sunburst Chart Tableau Prep Template
Jared Flores, Put Some Prep in Your Step
Server
- Tableau Catalog is Awesome - Here's Why
Brandi Beals
- Tableau Server vs. Tableau Cloud (Online): What’s Best for Your Business?
Aidan Bramel, Tessellation
Tips and Tricks
- How to Swap Worksheets in a Tableau Dashboard (v 2022.2+)
Eric Parker, OneNumber
- How to Anonymize Your Data for the Tableau Community Forums
Katie Kilroy, Data Katie
Visualizations
View last month’s Viz of the Day on Tableau Public gallery.
Relaterade berättelser
Subscribe to our blog
Få de senaste Tableau-uppdateringarna i din inbox.


