How to prep your survey data using only Tableau 10 and beyond


In writing about visualizing survey data using Tableau, I’ve found that the number one impediment to success is getting the data in the right format.
With Tableau 10 and on, it is, in fact, possible to get your survey data just so without having to invest in new tools and/or a engage in a time-consuming, error-prone procedure every time you need receive updated survey data.
What do I mean by "just so"? When I deal with survey data, there are usually four different elements that need to fit together:
- The demographic information (e.g., age of respondents, gender, etc.)
- Survey responses in text format
- Survey responses in numeric format
- Metadata that describes the survey data.
There’s a lot of upside to using Tableau to get your survey data just so. Everything is built into Tableau and you’ll just need to refresh the extracts (there will be several of them) as you get new data. The downside is the setup is a little bit cumbersome and some of the steps can be confusing.
Let me walk you through an example. If you'd like to follow along, you can download the data source here.
Three files and three extracts
Anyone that has read my posts or attended my classes know that I want survey responses in both text and numeric formats. Sure, you can in fact manage with one format or the other, but you’re just creating a LOT more work for yourself if you don’t have the data in both formats.
You will also need what I call a “helper” file. This is just a separate file that maps each question ID into human-readable form and groups related questions together. Again, you can certainly get by without it, but you’ll be working much harder than you need to, especially if you ever compare “importance” with “satisfaction” Likert-scale questions.
For this example, we will create a separate extract for each of these three files, then use Tableau’s ability to join three different data sources.
Let’s start by creating the extracts.
Extract 1: Pivot the data labels and create an extract
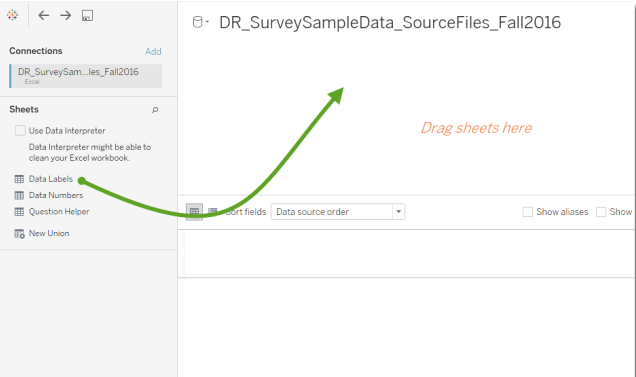
1. Start Tableau and indicate you want to connect to Excel.
2. Connect to DR_SurveySampleData_SourceFiles_Fall2016.xlsx and drag the sheet Data Labels into the "drag sheets here" area as shown below.
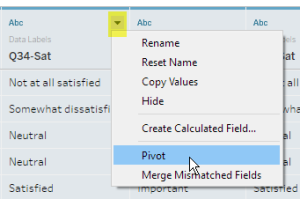
3. Leave the first five columns intact (the Resp ID, demographic stuff, and Weight) and select all the other columns.
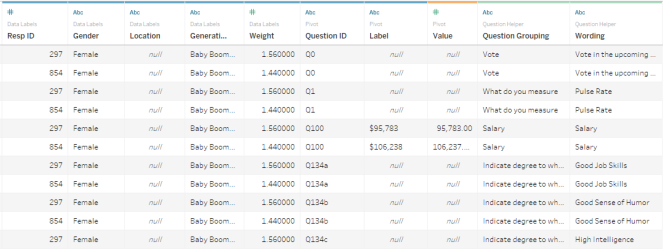
4. Click any of the selected columns and select "pivot" from the context menu.
5. Rename the first pivoted column "Question ID" and the second column "Label" as shown below.
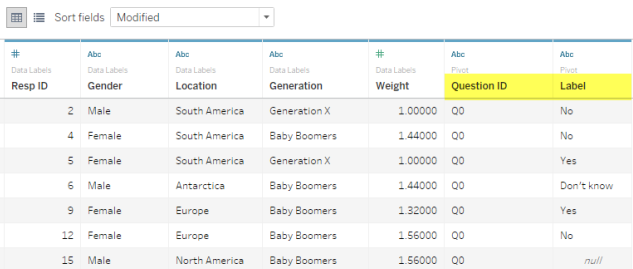
6. Indicate that you want to create an extract (look for the radio button toward the upper-right corner of the screen) and then click a sheet in your workbook to generate the extract.
7. When asked to save, name the file DR_JustSo_Labels.tde (make sure to note where you are saving the file).
One down, two to go.
Extract 2: Pivot the data numbers and create an extract
1. Click the New Data Source icon and indicate you want to connect to an Excel file.
2. As before, connect to DR_SurveySampleData_SourceFiles_Fall2016.xlsx, but this time drag Data Numbers to the "drag sheet here" area.
3. Hide the columns labeled Gender, Location, Generation, and Weight. We already have them in the other data source and don’t need them twice.
4. Leaving Resp ID in place, select the second through the last columns.
5. Click the down arrow on any of the selected columns and select "pivot" from the context menu.
6. Rename the first pivoted column "Question ID" and the second column "Value," as shown below.
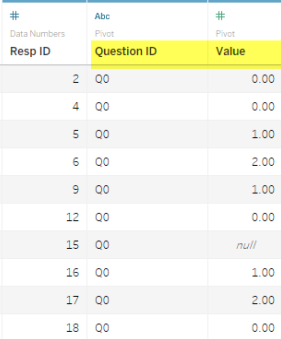
7. Indicate that you want to create an extract (look for the radio button toward the upper-right corner of the screen) and then click a sheet in your workbook to generate the extract.
8. When asked to save, name the file DR_JustSo_Numbers.tde.
Two down, one to go.
Extract 3: Create the question-helper extract
1. Click the New Data Source icon and indicate you want to connect to an Excel file.
2. As before, connect to DR_SurveySampleData_SourceFiles_Fall2016.xlsx, but this time drag Question Helper to the "drag sheet here" area.
3. Indicate that you want to create an extract (look for the radio button toward the upper-right corner of the screen) and then click a sheet in your workbook to generate the extract.
4. When asked to save, name the file DR_QuestionHelper.tde.
All three data sources are now ready.
Join the three data sources
We now have our three data sources as separate Tableau extract files. We’ll combine these three files (and create an extract from the joined files) using Tableau 10’s ability to join files from different data sources. This is where things can get a little confusing.
Note: When I first tried this, Tableau presented a lot of warning messages about not being able to materialize a temporary table. While I could ignore these warnings and muddle through, you may not be so lucky. It turns out the culprit was my anti-virus software. I temporarily disabled it and everything worked without a hitch. See this Knowledge Base article.
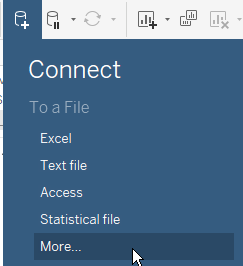
1. Click the New Data Source icon and indicate you want to connect to More, as shown below.
2. Select DR_JustSo_Labels.tde and click "open."
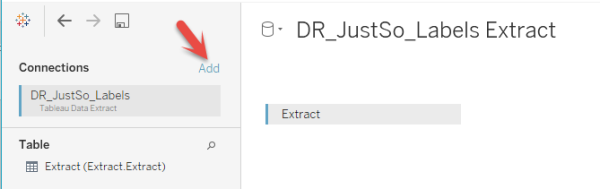
3. Click Add, as shown below.
4. Click More and select DR_JustSo_Numbers.tde. Do not be fooled—the correct fields have NOT yet been joined.
5. Click the overlapping Venn diagram to display the join dialog box, as shown below.
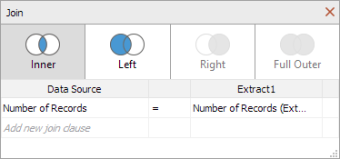
6. Click Number of Records and click the X that appears in the row to indicate you do NOT want to join these two data sources using this field.
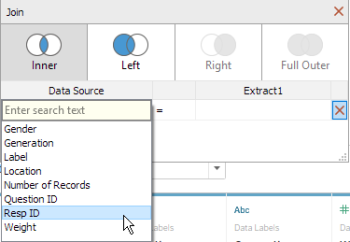
7. From the left data source, indicate you want to join using Resp ID, as shown below.
8. From the right data source, indicate that you want to join using RespID (Extract1). I have no idea why the field is named this way. More on this in a moment.
9. From the left data source, indicate that you want to join using Question ID. Yes, you need to join on more than one field.
10. From the right data source, indicate you want to join using Pivot Field Names (Extract1). (You may be wondering why the field isn't also called Question ID. When using data extracts (.TDE files), Tableau is only able to keep track of the alias names for fields in the first .TDE file. All of that info gets stripped out from the second .TDE file and Tableau just sees the original field name (Pivot Field Names). This behavior may be a little off-putting, yes, but it's easy to address and it won’t matter a lick once we’re building our visualizations.)
11. Click Add again, select More, and select DR_QuestionHelper.tde.
12. Click the second Venn overlapping circle and remove any of the joins that may be in there (most likely again using Number of Records).
13. From the left data source, select Question ID, and from the right data source, select QuestionID as shown below.
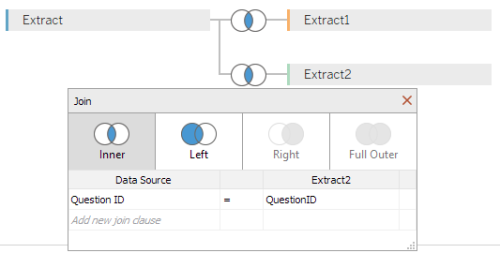
14. Hide the fields RespID (Extract1), both Number of Records fields, the second Question ID, and Pivot Field Names, and rename Pivot Field Values to Value. Your screen should look like this.
15. Indicate that you want to create an extract (look for the radio button towards the upper-right corner of the screen) and then click a sheet in your workbook to generate the Extract.
16. When asked to save, name the file DR_JustSoAll.tde. After creating the extract Tableau will show all the field names grouped by data source, as shown below.
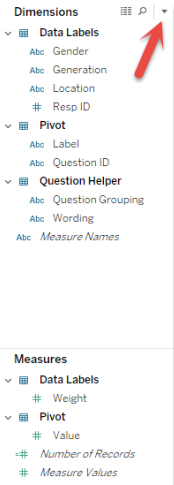
17. Click the down arrow and select Group by Folder. (Okay, you don’t have to do this but I see no reason to group the fields by data source.)
So, how do you get the extracts to refresh?
Good question. If you are using either Tableau Server or Tableau Online, you can create shared data sources and program the extract to refresh on a regular or as-needed basis. If you are using Tableau Desktop and you have all four data sources in in one workbook, you can just click the Data menu and select Refresh All Extracts.
Conclusion
While I find the process outlined here both cumbersome and confusing, this approach does appear to work and you only need to set it up once. The same cannot be said of the Tableau add-in for Excel which requires a lot of manual intervention every time you want to update the data.
Will this replace Alteryx as my tool of choice? No, but it does work and you can’t beat the price.
For more tips and tricks on working with survey data, check out Steve's upcoming virtual class on visualizing survey data.
Relaterade berättelser

How Team USA uses data to build a digital HQ
 8 Februari, 2022

Datatrender som kommer att göra avtryck under 2022
 3 Februari, 2022

Healthcare Analytics Hub Starter Kit: Get the data you need faster
 18 Oktober, 2019
The purpose of the Healthcare Analytics Hub Starter Kit is to provide a sample of what your healthcare app could look like. It’s not a complete solution; instead, it’s focused on what’s possible. Please contact your Tableau Account Manager to get started today!
Subscribe to our blog
Få de senaste Tableau-uppdateringarna i din inbox.