Jedi Tricks with Marc Rueter


Field notes from Jennifer Vaughan, Product Consultant, at #TCC11:
A session packed with tips and tricks of Tableau and better ways to analyze your data, from the Jedi master himself Marc Rueter, AKA @tableaujedi.

The line after the session to meet Yoda, I mean Marc, the Jedi master.
There are a lot of different ways to combine data into a richer experience. Marc shows the audience how to see multiple levels of your data using multiple marks and dual axis. A bar chart of sales by State now with a Dual axis allows us to plot the sales by zip code as circles.
From this:
To Wow: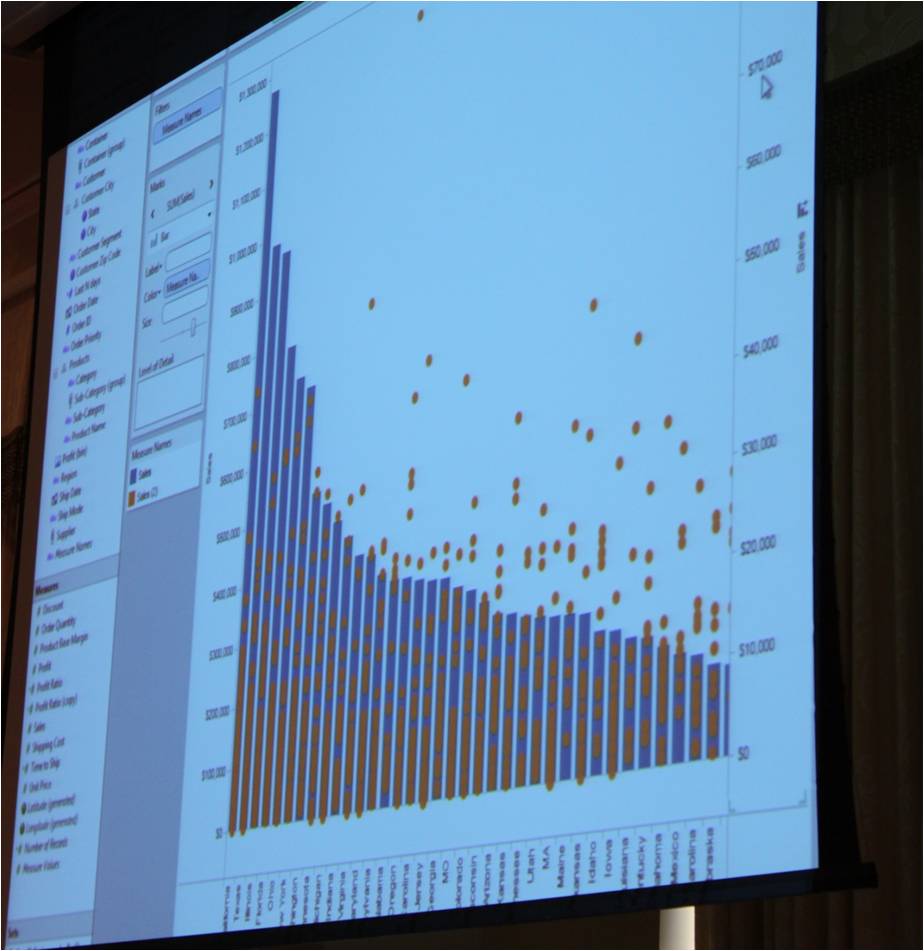
One of the major themes in this talk was that by considering multiple levels of your data – summary results and breakdowns at the same time -- you can get great insight. Marc covered multiple marks on a map, filters and actions, and some wicked calculated fields.
Subscribe to our blog
Få de senaste Tableau-uppdateringarna i din inbox.