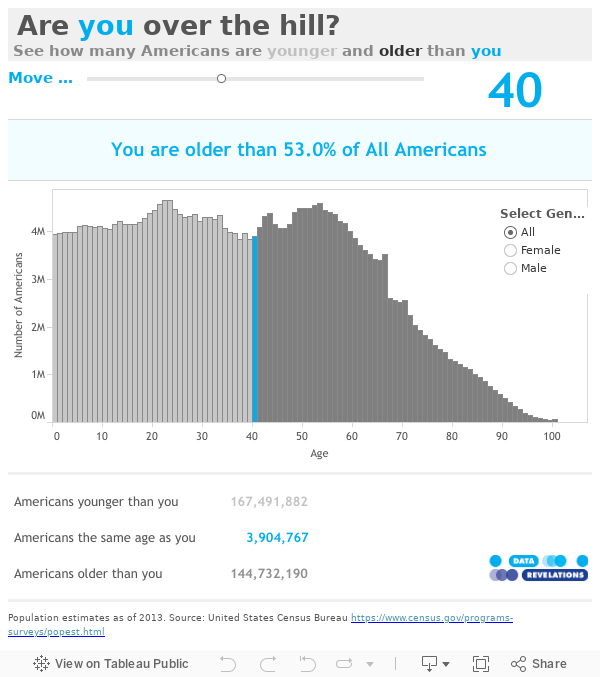
Are you over the hill?
This viz by Steve Wexler is the perfect example of making analytics simple, but not simplistic. Explore to see how your demographics compare with American ages and genders.
Create and share on Tableau Public
Join the newsletter and find daily inspiration with the Viz of the Day. Yours could be featured next!
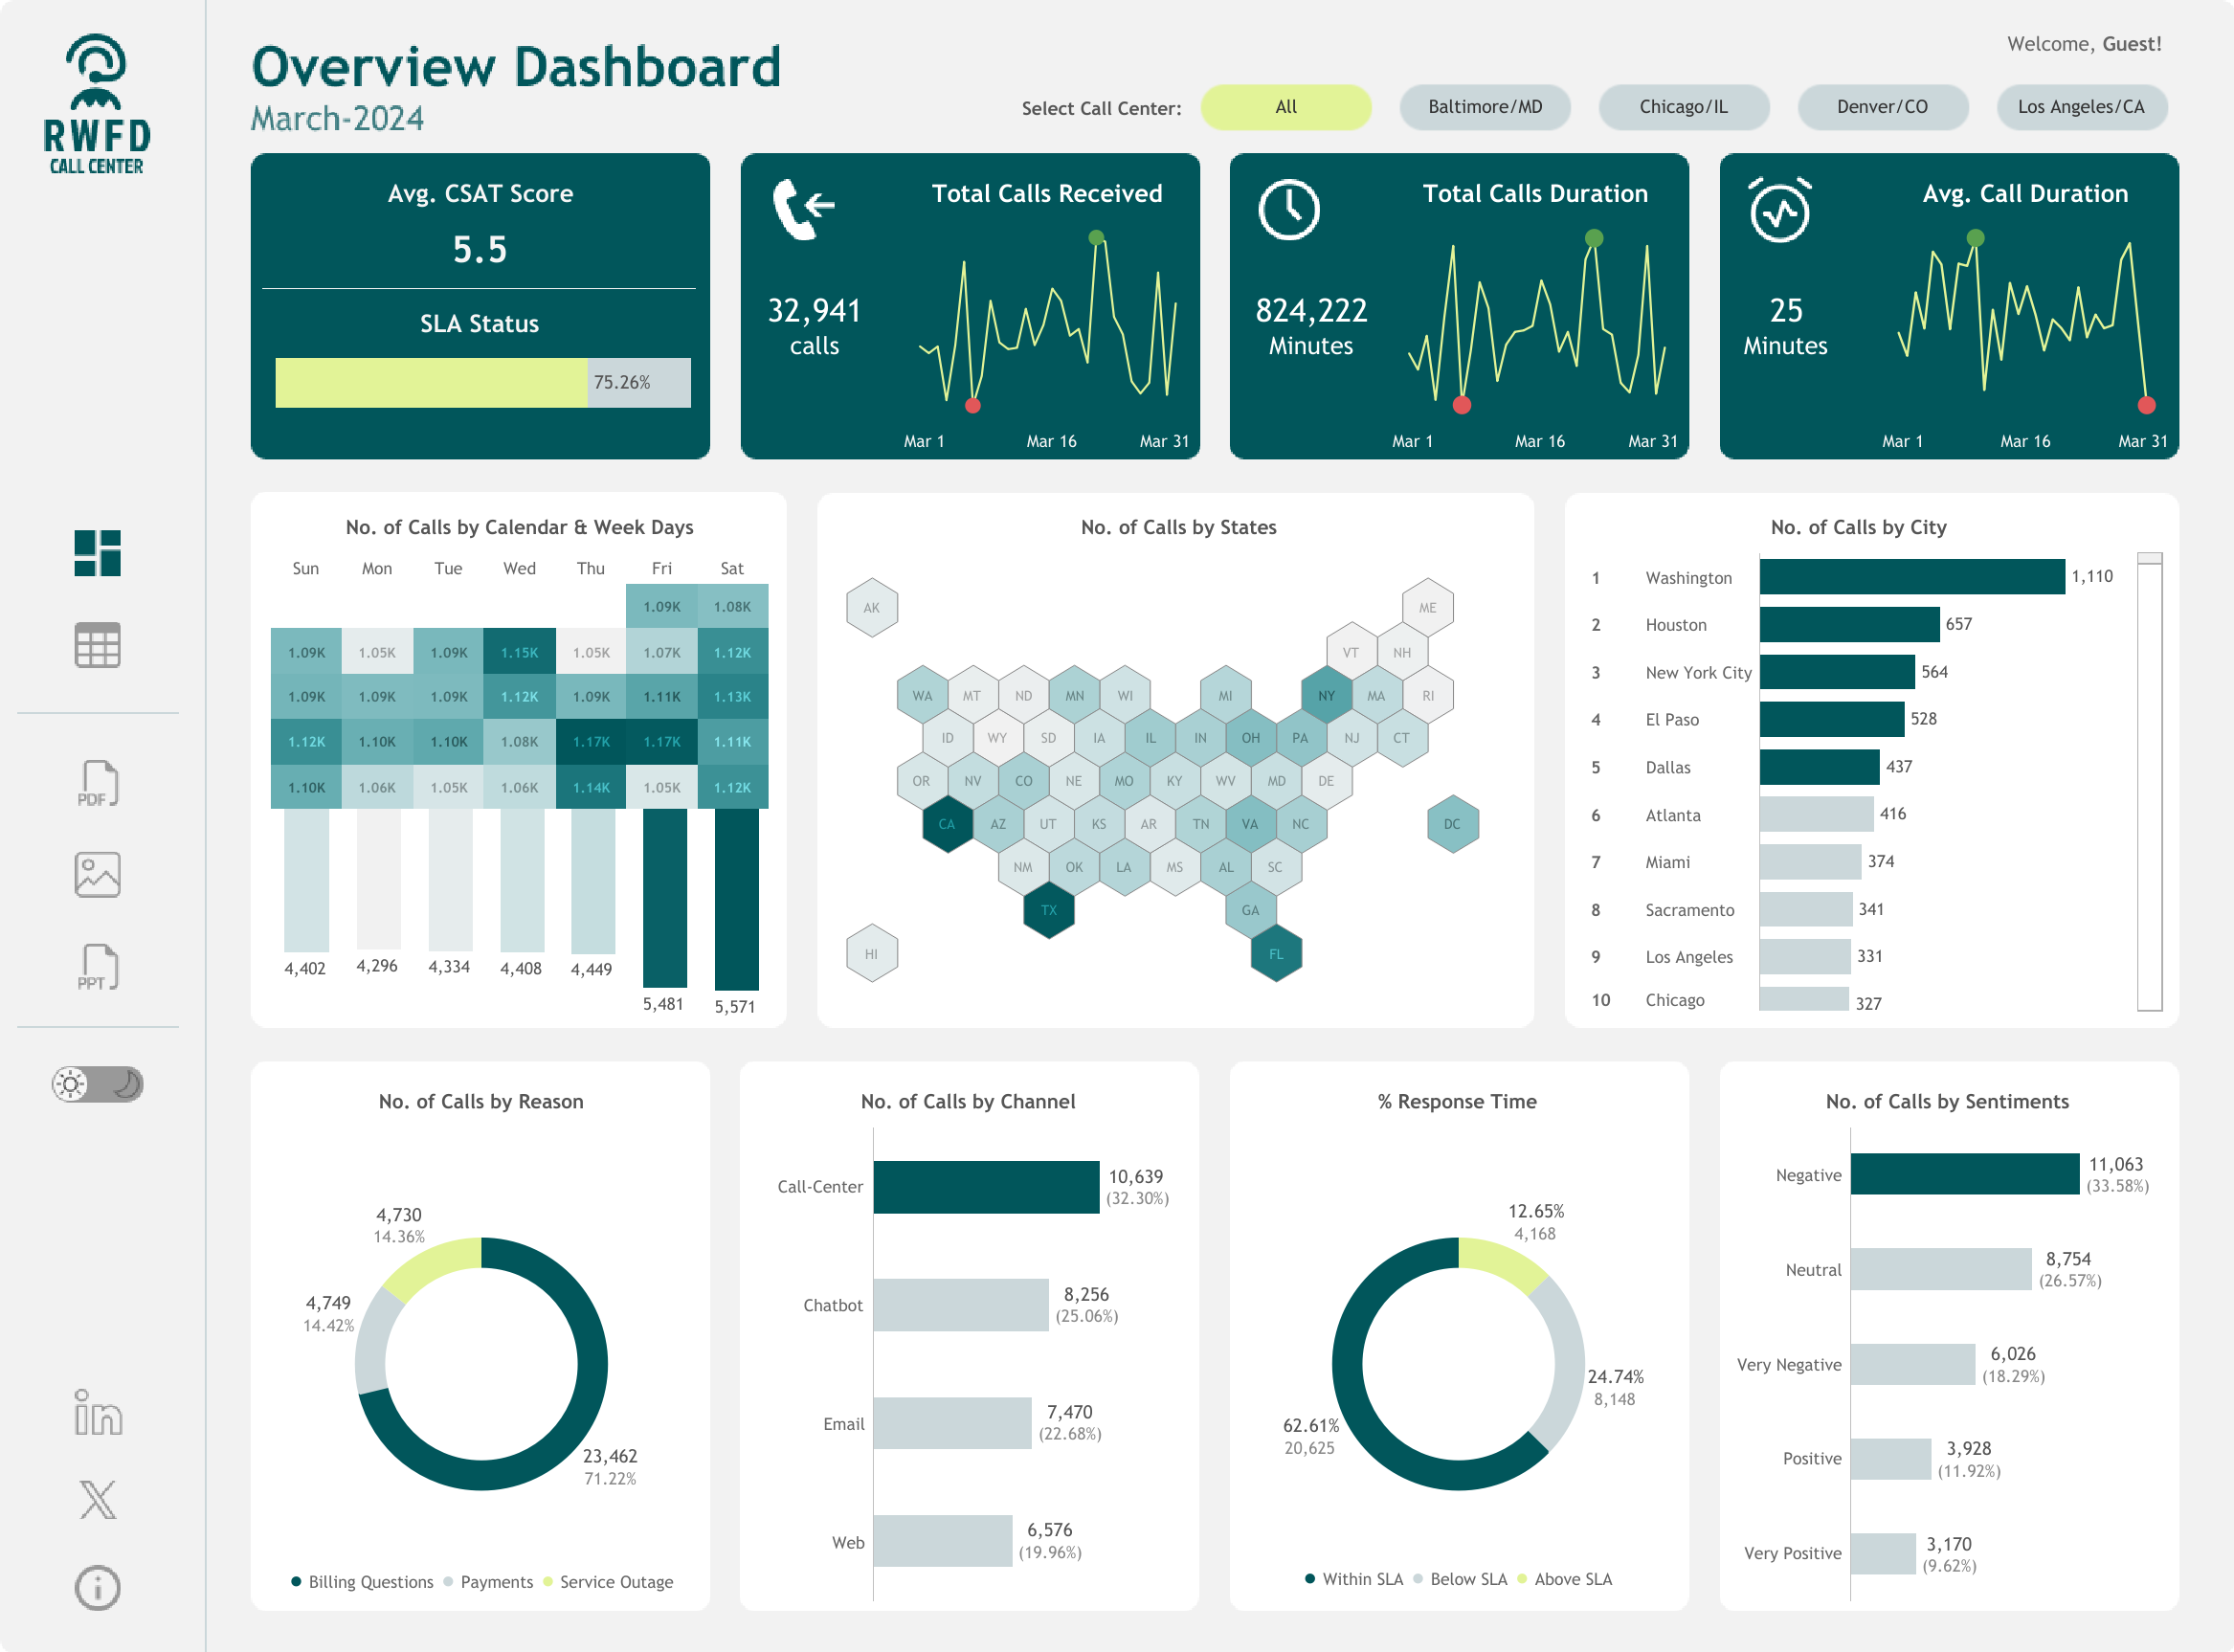
Call Center Dashboard
Get into call center insights with this #VizOfTheDay—a #RWFD entry by Waqar Ahmed Shaikh. Toggle between light and dark modes and analyze total calls, duration, response time, and more. Viz inspired by Gander Goldestan, and Ahmed Shyam.
Interact with the viz