CFO Dashboards
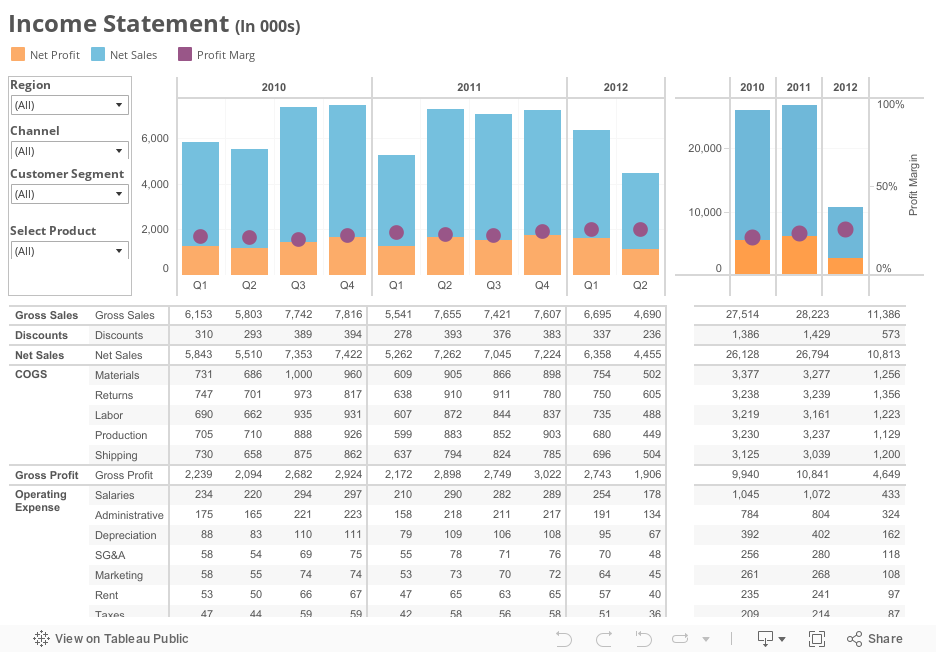
Here is an example of exactly that. The top two views provide an overall picture of your quarterly and yearly performance over the past three years—including key financial measures such as net sales, net profit and net profit margin. On the bottom, cross-tabs give you detailed breakdowns of your profit and loss statement using the same quarterly and yearly format as the views above. Most importantly, you can adjust your view using the filter panel in the top left corner. Whether you want to view your numbers according to region, channel, customer segment, or product category, the results are right at your fingertips.