Tableau Server
You've analyzed your data and discovered new insights. Now you want to share them. Introducing our second product, Tableau Server, a business intelligence application that provides browser-based analytics everyone can learn and use.
Anyone in your organization can view your published work online, so long as they have the proper security permissions. Interactions are live and on the fly, including filtering, highlighting and drill downs. And it's all in the web browser; no downloads, plugins or coding required.
Welcome to rapid-fire business intelligence.
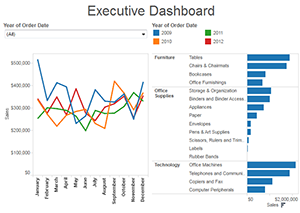
Dashboards
Dashboards are a fundamental tool for presenting your data. You've used Tableau Desktop's worksheets to explore your data and perform valuable analysis. Combine all of those worksheets onto a dashboard to provide the big picture of your data.
We've also enabled our analytics capabilities to work across all worksheets in a dashboard. Take quick filters, for example. They can be used to filter all of your data on a dashboard at once with a couple clicks of a mouse, no coding required.
Improved Visual Styling
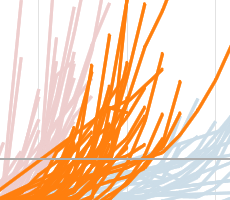
Visual information is at the heart of Tableau's products, and this release improved many aspects of how information is presented. This includes better default positioning, including the orientation of text and numbers. Even the physical layout of filters, legend cards and charts are more intuitive and adapt for each item's size.
Color legends are also interactive. Selecting one color highlights all selections of that color while graying out all others. This easily allows you to home in on the data that is important to you.