DataFam Roundup: October 4 - October 8, 2021


Dig into the latest DataFam Roundup—a weekly blog that brings together community content all in one post. As always, we invite you to send us your content—and the DataFam content from your peers that have inspired you! Find the content submission form here.
DataFam content
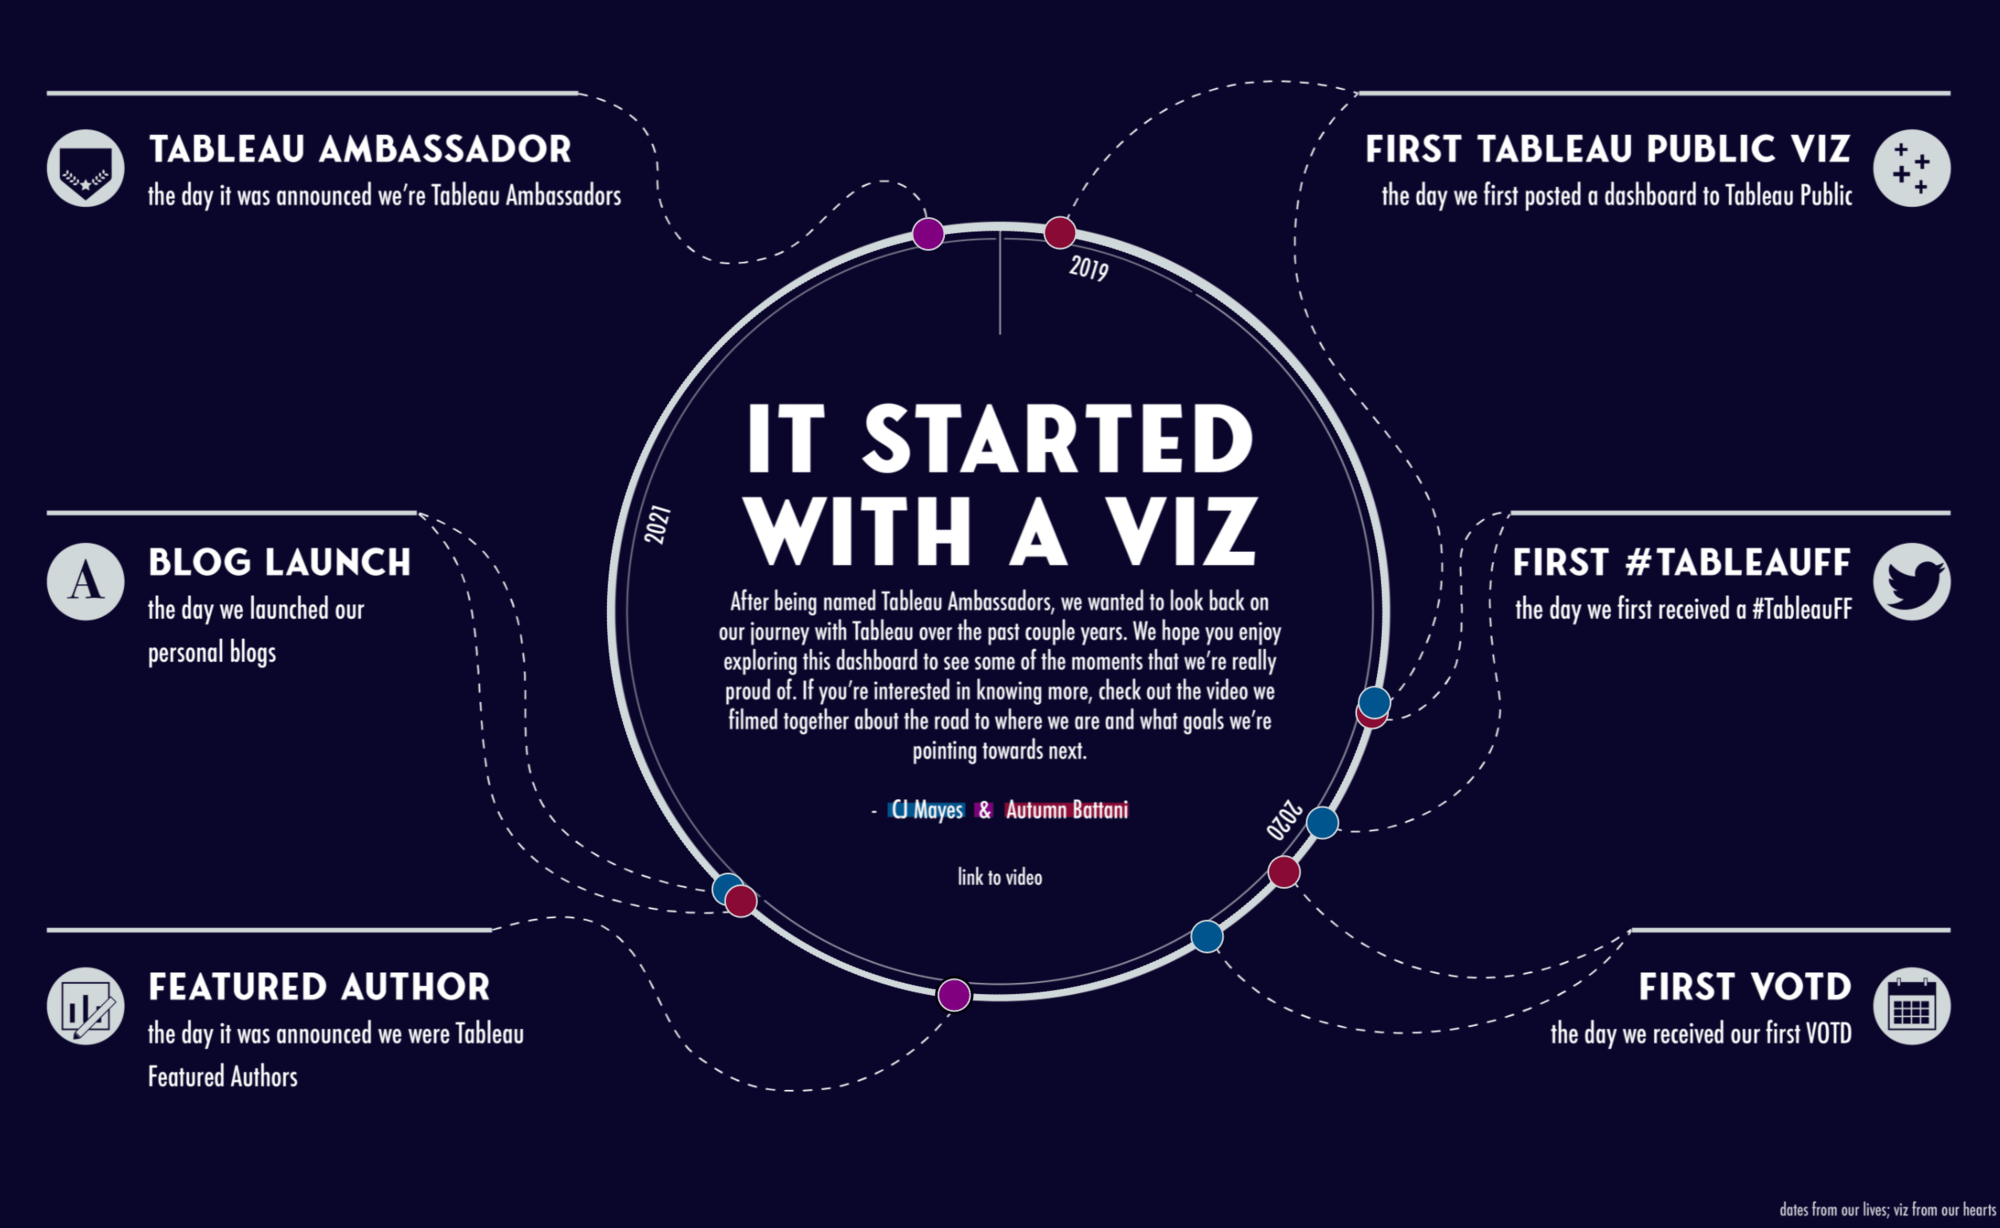
Autumn Battani, Make It Make Sense: Radial Timeline Template
Dive into content created by the Tableau Community:
- Ken Flerlage, The Flerlage Twins: 4 Tips for Writing Complicated Tableau Calculations
- Autumn Battani, Make It Make Sense: Radial Timeline Template
- Jim Dehner: Sets and Filters the Condition and Top N Tabs - What do they do?
- Vani Agarwal: Labels and Coloring Tips
- Dawn Michelle, Tech Tips Girl: Multiple Charts in the Tooltip?
- Ann K. Emery and Zach Bowders, Depict Data Studio: Navigating Tableau's Resources
- CJ Mayes and Lindsay Betzendahl: What’s Good? Blending Figma & Tableau With Lindsay Betzendahl. (October)
Upcoming events and community participation

Tableau Conference Register Today!
- Tableau Conference: Join Tableau and the world's largest data community online for three days of learning, connection, and inspiration. Register Today!
- Iron Viz, the world’s largest virtual data visualization competition—ignites and showcases the power of the Tableau Community, giving you the opportunity to interact with data rockstars worldwide. Three finalists will advance to the 2021 Iron Viz Championship this November at Tableau Conference.
- #Viz4Climate Action Viz Challenge - Participate by October 10th! #TheSDGVizProject is thrilled to team up with Tableau for the #Viz4ClimateChange challenge leading up to the #COP26 UN Climate Conference. Submit your climate related vizzes by October 10th for a chance to win one of three $100 gift cards to the Tableau Store, and to be featured on Tableau Public! Vizzes will be judged by Andy Cotgreave (Tableau) and Clayton Aldern, data journalist at Grist. Click the link for challenge guidelines.
- The 2021 Vizzies Award Nominations The Tableau World Podcast loves to recognize the awesomeness of the Tableau community, beyond those who have been recognized by Tableau as Zen Masters (including the HOF TZM). So without further ado, we present the 7th Annual Vizzies. Nominations are open through October 31st.
- Tableau's Pre-Release and User Research Community Welcome to our new Pre-Release and User Research Community! This new website enables us to make early software and other feedback opportunities more accessible to you and in turn makes it easier for you to provide input to us. Enjoy!
- Tableau Community Braindates: October 12 at 12pm PT - October 14 at 12pm PT Braindates are back and just in time to get some Pre-TC conversations started early. Meet with groups of 1-8 for intentional, 30-45 minute knowledge-sharing conversations about any topic of your choice or creation. Have a hobby, data problem, or idea that you'd like to share or discuss with the community? Braindates can help!
- Chart Chat, Round 24, Oct 13, 2021 11:00 AM ET Watch as Jeffrey Shaffer, Steve Wexler, Amanda Makulec, and Andy Cotgreave, debate the good, the bad, and the “scaredy-cats” of data visualization.
- A Cup of Data vol 4, UX Workshop, November 12th, 10 AM CT - 11.00 AM CT Join us for the fourth session of our Cup of Data series where we expand on your Tableau CRM skills. Yet again we are changing up the format and making this session different. This time we’re joined by User Experience Principal, Elena Migunova, for a UX Workshop.
Vizzes
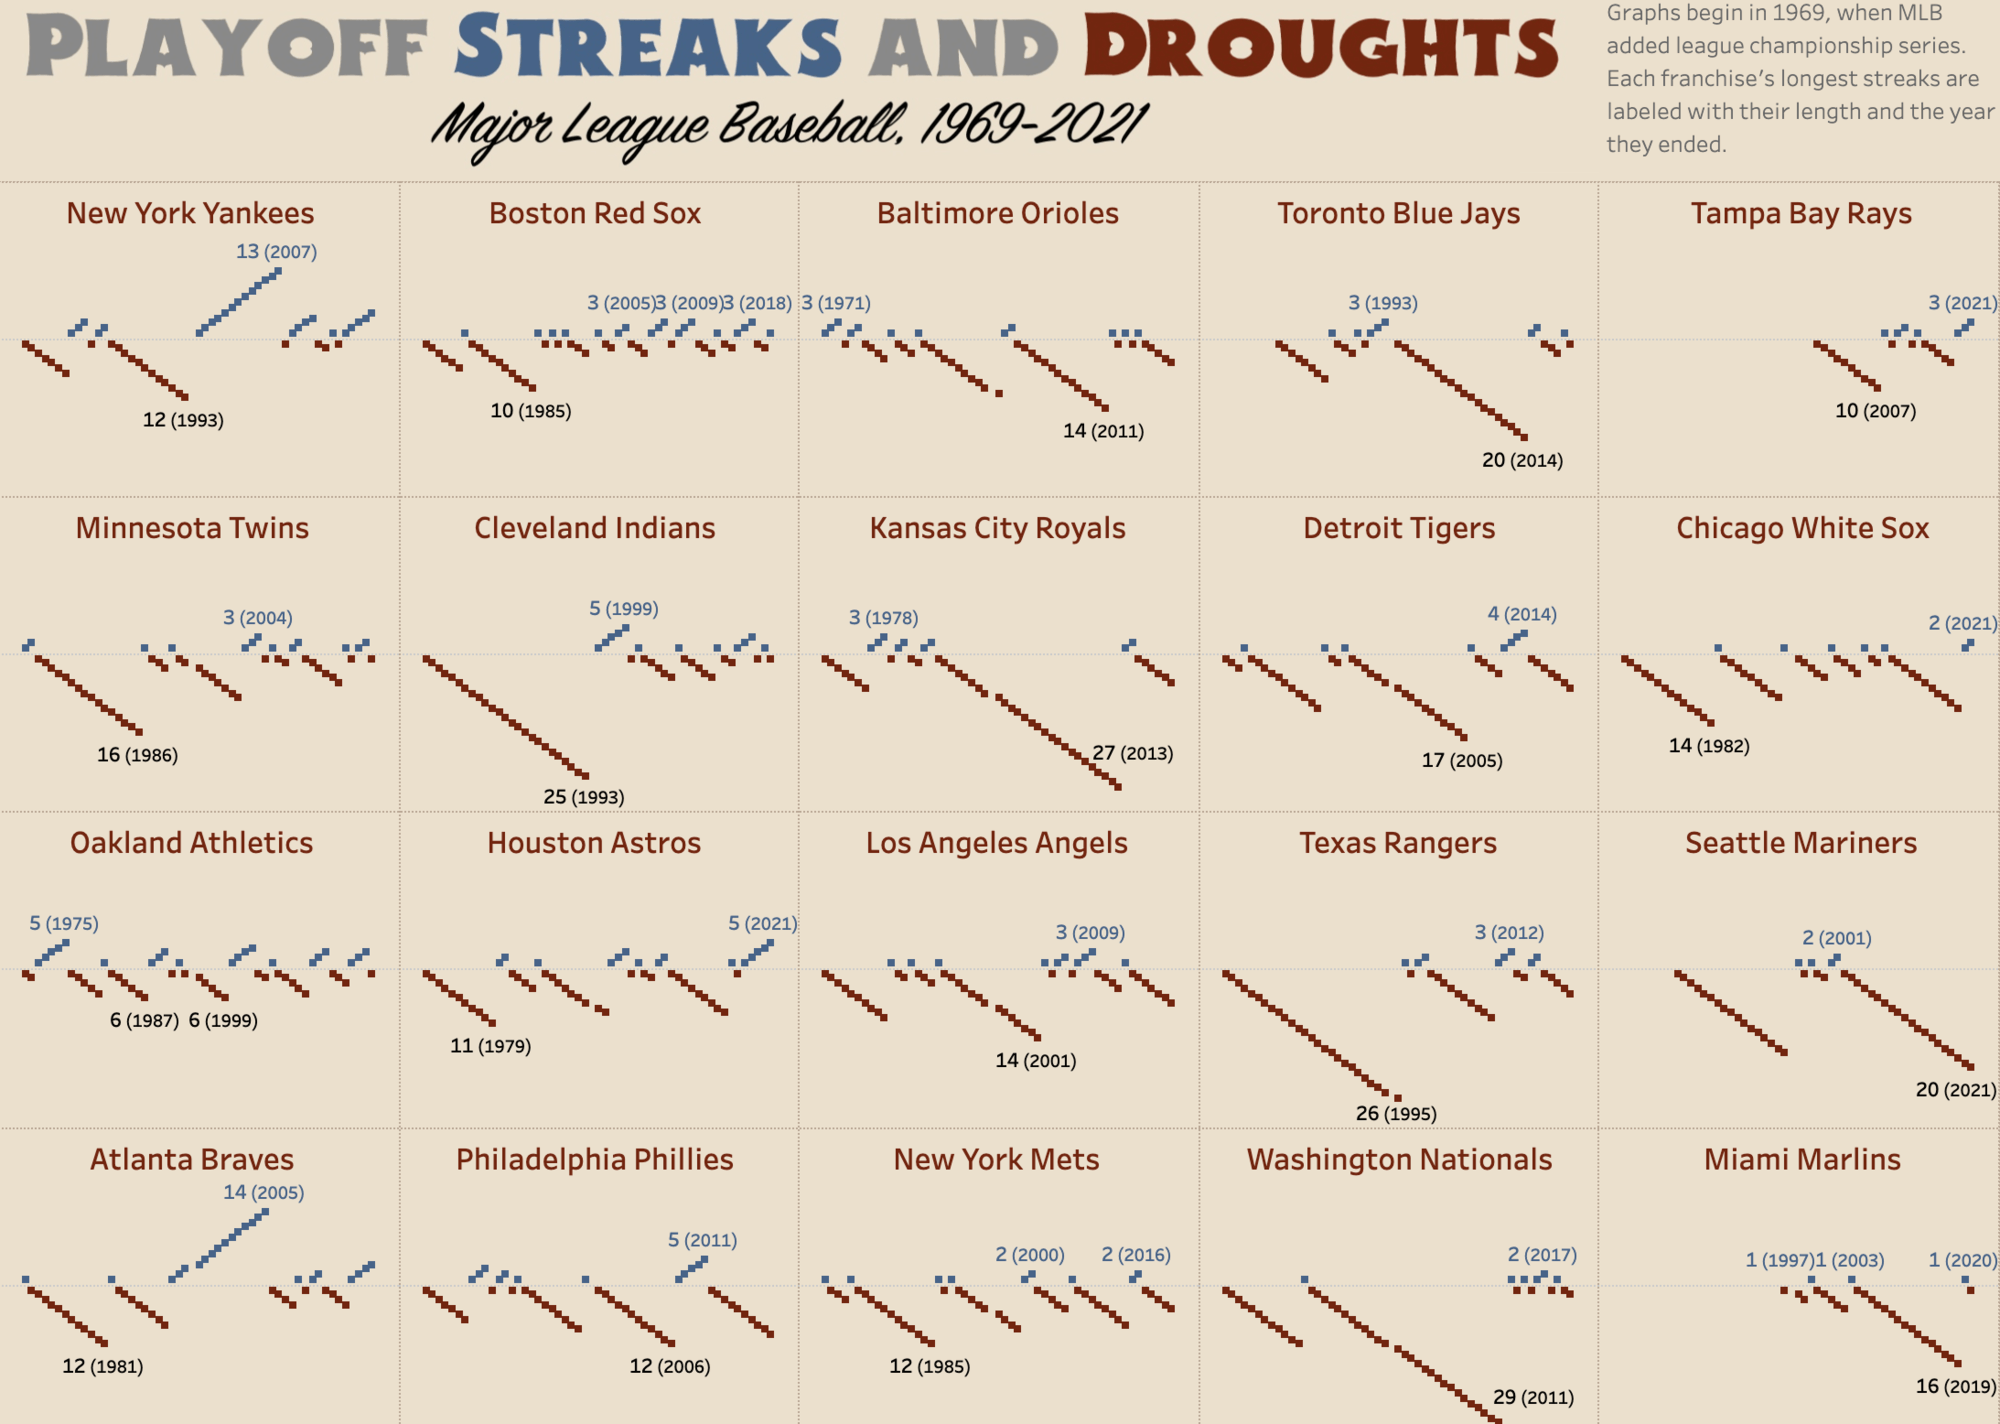
Bo McCready: Playoff Streaks and Droughts in Major League Baseball
Catch this week’s Viz of the Days here and subscribe to get them emailed directly to your inbox.
Check out some inspirational vizzes created by the community:
-
Bo McCready: Playoff Streaks and Droughts in Major League Baseball
-
Zach Bowders: data dump - 007th
Community Projects

Workout Wednesday
Build your skills with a weekly challenge to re-create an interactive data visualization.
Web: Workout Wednesday
Twitter: #WOW2021
Week 40: Can You Make Stacked Bar Charts Easier to Compare?
Sports Viz Sunday
Create and share data visualizations using rich, sports-themed data sets in a monthly challenge.
Web: Sports Viz Sunday
Twitter: #SportsVizSunday
September 2021: Sporting Heroes & Legends
Iron Quest
Practice data sourcing, preparation, and visualization skills in a themed monthly challenge.
Web: Iron Quest
Twitter: #IronQuest
September 2021: Sporting Heroes & Legends
Storytelling with Data
Practice data visualization and storytelling skills by participating in monthly challenges and exercises.
Web: Storytelling with Data
Twitter: #SWDChallenge
October 2021: makeover challenge
Project Health Viz
Uncover new stories by visualizing healthcare data sets provided each month.
Web: Project Health Viz
Twitter: #ProjectHealthViz
September 2021: Biggest Healthcare Data Breaches
SDG Viz Project
Visualize data about Sustainable Development Goals provided by the World Health Organization.
Web: SDG Viz Project
Twitter: #TheSDGVizProject
COP26 UN Climate Change Conference: #VIZ4CLIMATEACTION
Preppin' Data
A weekly challenge to help you learn to prepare data and use Tableau Prep.
Web: Preppin’ Data
Twitter: #PreppinData
Week 33: Excelling at adding one more row
Real World Fake Data
Create business dashboards using provided data sets for various industries and departments.
Web: Real World Fake Data
Twitter: #RWFD
Dataset #12: Hospitality
Viz 2 Educate
Each month, create vizzes on global education syllabus topics as resources for teachers worldwide.
Web: Viz 2 Educate
Twitter: #Viz2educate
Topic: Microbiology
Diversity in Data
An initiative centered around diversity, equity & awareness by visualizing provided datasets each month.
Web: Diversity in Data
Twitter: #DiversityinData
Viz for Social Good
Volunteer to design data visualizations that help nonprofits harness the power of data for social change.
Web: Viz for Social Good
Twitter: #VizforSocialGood
Makeover Monday
Join the community every Monday to work with a given data set and create better, more effective visualizations.
Web: Makeover Monday
Twitter: #MakeoverMonday
Histórias relacionadas
DataFam Roundup: April 15–19, 2024
 19 Abril, 2024

DataFam Roundup: April 8–12, 2024
12 Abril, 2024
DataFam Roundup: April 1–5, 2024
5 Abril, 2024
Subscribe to our blog
Receba em sua caixa de entrada as atualizações mais recentes do Tableau.