Value series: Time to reevaluate how you measure the value of your analytics


Editor's note: This is the third post in our series about the value of analytics for transformation. In previous posts in this series, we explored evaluating and deploying analytics for transformational value. Today, we're going to look at how to measure the impact of your analytics investment.
Organizations with modern analytics and a culture that prioritizes facts are more likely to use their data to drive new revenue streams, cost savings, and efficiencies. But how do you understand its effectiveness? Establishing the right metrics to track value will not only help you prove your analytics investment, but identify areas to focus attention and increase its value.
Different models to more holistically measure ROI
Depending on where your organization is at with modern analytics and what your goals are, the metrics you use to measure the success of your program may differ, and will likely change as your deployment matures and scales.
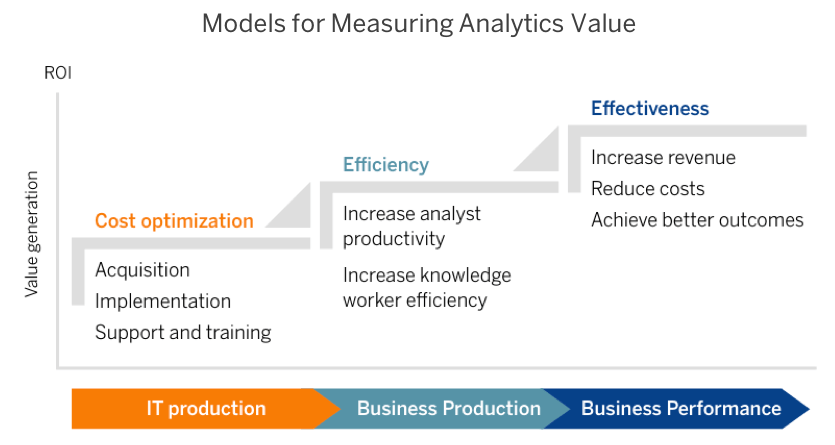
There are several different models organizations can use to calculate ROI. Using them together offers a more complete and compelling story of the value of your investment as it matures.
- Total cost of ownership (TCO) — The most obvious cost when considering analytics technology is the cost of licensing the software. However, many other costs contribute to the total cost of owning a solution. Understanding platform costs, like hardware and software, plus the labor costs to deploy and support the solution can be a helpful starting point during a technology evaluation. But, TCO falls short of providing a holistic view of ROI when you start to consider other ways the technology adds value to employees and the organization.
- Worker productivity — If an employee spends less time on analysis with a more efficient solution, we assume that the time saved translates to either more analysis or other activities—either way, more value added to the business. However, evaluating the impact of productivity requires a certain level of understanding of who is using analytics software, and how their bandwidth influences their value to the organization.
- Expected impact — What’s the value of your employees making better decisions with analytics? With a mature analytics program, you’re likely to accurately estimate the payouts of data-driven decisions—including how analytics influence cost reductions, increased revenue, and better business strategy. While this presents the most challenges to quantify in a model, it’s also the truest to evaluating the impact of tying your technology to real business outcomes.
Learn more about calculating BI value with these three models—including examples and when it’s best to use these scenarios.
The serendipitous value that you can’t plan for
Expanding your definition of business value is important to capture ROI that cost-based models don’t measure. But there is also value that can’t be captured effectively in any model—value that springs more serendipitously from modern analytics programs. In fact, these “business moments” are impossible to plan for, yet organizations increase their chances of encountering them when more people with deep, functional expertise go looking for insights.
A knowledge worker might be chasing one business question, but discover a valuable insight by pivoting to another. In the case of Southwest Airlines, analysts discovered opportunities to add new, direct flights closer to customers’ homes, thanks to patterns in customer data. Or sometimes while exploring data, a curious person may stumble across a finding with significant one-time impact. For example, through an embedded analytics solution, a customer of RollMaster found that they were losing as much as $100,000 when a salesperson stopped offering a certain product. This insight came after just 15 minutes of exploring the data in a new, visual way.
This brings to mind a famous design concept from Damien Newman. “The Design Squiggle” illustrates a creative process from the messy, early stages of research and uncovering insights all the way through “eventually concluding in one single designed solution.” This effectively parallels the journey of creating dashboards, especially where a flexible analytics platform allows for pivots in analysis as new insights are discovered and subsequent questions are asked. Even today, there are analytics solutions that fixate on the end of the design process during earlier stages, which limits users from discoveries within the squiggle.
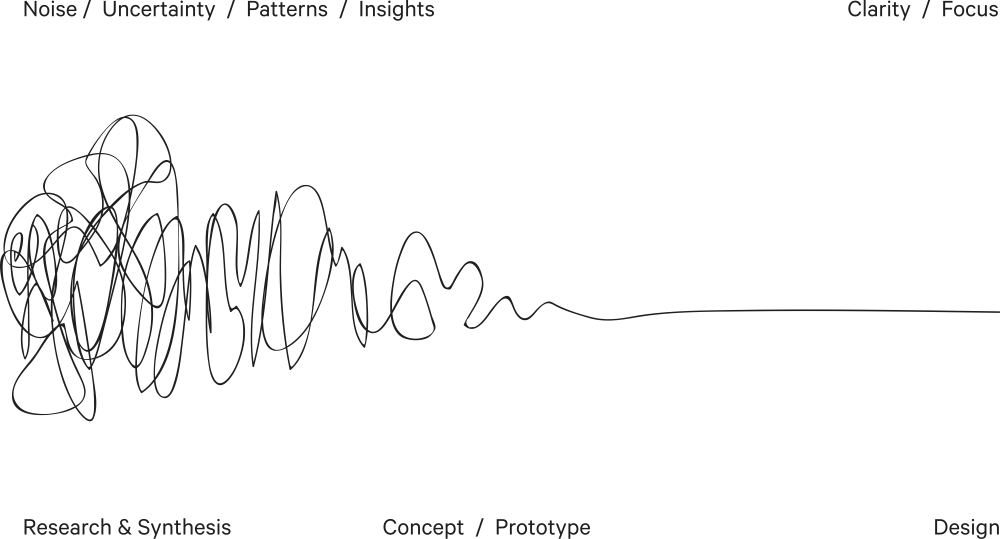
The Process of Design Squiggle by Damien Newman, courtesy of thedesignsquiggle.com.
It’s in this wild, beginning stage—uncertainty and opportunity intertwined—where highly valuable and serendipitous discoveries occur. Though the impact is tangible, you can't build a model to anticipate or account for these types of moments. However, you can increase the likelihood of them happening when you empower more of the organization with data access, literacy and skills, and a flexible solution that enables exploration and discovery.
Learn how you can accurately capture analytics value
Learn more about creating and measuring value with our webinar series. We’re excited to have our customer Dropbox, partner Slalom, and market research analyst Forrester—we hope you’ll join us!
Read the final post in our series about the value of analytics for transformation: Measuring and adding value go hand in hand with modern analytics.
Histórias relacionadas

How Team USA uses data to build a digital HQ
 8 Fevereiro, 2022

Tendências de dados que causarão impacto em 2022
 3 Fevereiro, 2022

Healthcare Analytics Hub Starter Kit: Get the data you need faster
 18 Outubro, 2019
The purpose of the Healthcare Analytics Hub Starter Kit is to provide a sample of what your healthcare app could look like. It’s not a complete solution; instead, it’s focused on what’s possible. Please contact your Tableau Account Manager to get started today!
Subscribe to our blog
Receba em sua caixa de entrada as atualizações mais recentes do Tableau.