Tackling Nest thermostat data with Tableau Prep


Editor's note: A version of this article was originally published on VizPainter.com.
Last year, I went home from the Teknion Christmas party with a shiny, new Nest Learning Thermostat. Sure, I was excited about the potential energy savings but being the data geek I am, I was more excited about the idea that I could capture tons of Nest thermostat data and then visualize it in Tableau! So for the past year, after figuring out how, I’ve been collecting lots and lots of data.
Collecting Nest thermostat data in Google Sheets
Nest makes some of the data available via weekly reports, but it’s nowhere near as detailed as I’d like. I mean, I want minute-by-minute snapshots of inside/outside temperature and humidity. I want to know if my AC or Heater is running, etc. Fortunately, Nest has an API that you can use to get at the detail data. It took some digging, but I found a GitHub project where Michael Pesce leveraged some work by Beezly—all focused on automating the pull of Nest data into a Google Sheet document.
As Michael notes, there is a limit to how many rows of data a single Google Sheet document will allow and storing a record every few minutes will quickly hit that limit. His solution was to continually update certain variables, add together others, average others, and just keep one record per day. But I really wanted the minute-by-minute Nest thermostat data.
My solution was to modify the script (download my modified version here) to still keep one record per day, but to concatenate values together with time stamps all in one exceedingly long string (per measure) where just two entries might look like:
|34.66@Tue Feb 19 2019 22:42:10 GMT-0600 (CST)|34.66@Tue Feb 19 2019 23:02:10 GMT-0600 (CST)
I set the script to automatically run every minute (see instructions in the script comments). So, by the end of the day, I’ll have a bunch of really, really long strings. By the end of the year I have a bunch of records with a bunch of really, really long strings.
I know...it’s a horrible data structure. But I have a tool that takes horrible data structures and turns them into gold.
Dealing with messy data: Tableau Prep for the gold!
All of the Nest thermostat data I capture via the script is in a Google Sheet and I can directly connect to it with Tableau Prep (versions 2019.4 and newer)! The Tableau Flow itself looks a bit complex, but it’s mostly just the same steps duplicated for each measure:

Each piece, like Inside Temps is primarily splitting the really, really long string:

then pivoting so that all those measurements and times are together in a single column:

And then doing some additional splitting out of the measure from the timestamp, parsing the date and time, and changing data types:
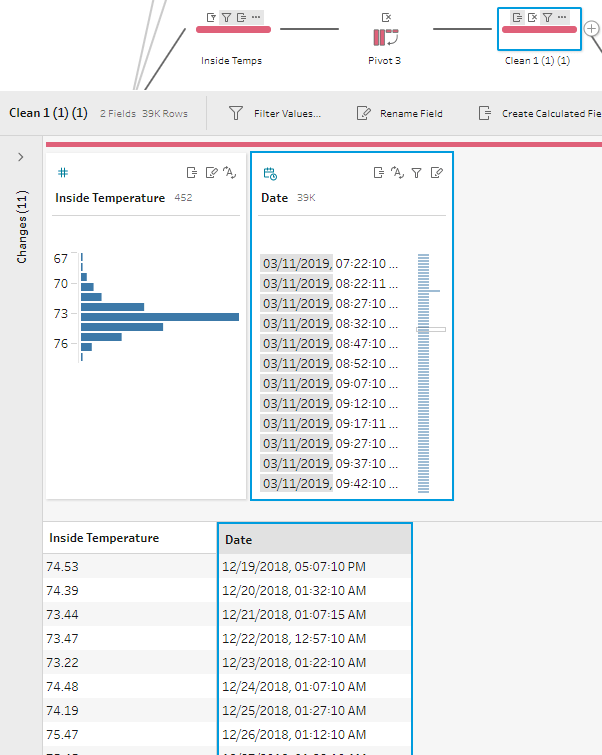
The same pattern is reused for each metric. Good thing you can copy and paste to reuse steps in Tableau Prep! When all measures are done, we can union them together:

The union results in a single table with a column for each measure, but they are split out across different rows, so only one measure has a value on any given row and the rest are NULLs. We can collapse the rows with an Aggregate step that groups by the timestamp and uses a MIN (or MAX) for each measure:

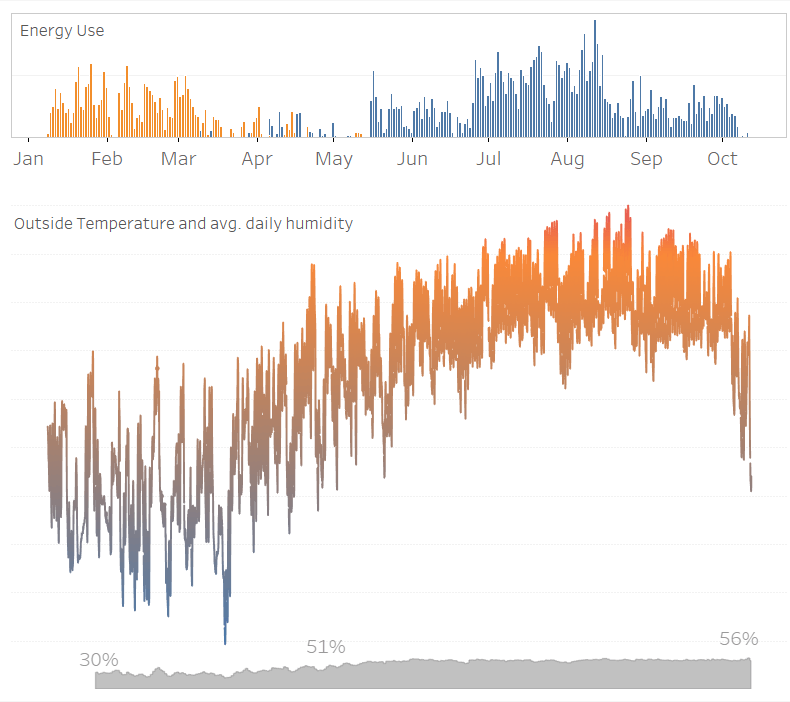
The script also captured the overall weather for each day (cloudy, sunny, rainy, thunderstorms, snow, etc.) and so I join that in at the day level. There’s no end to what I can do with the Nest thermostat data in Tableau now that I’ve captured it and cleaned it up with Tableau Prep:
Looking for more Tableau Prep content? Check out Joshua's blog post on how to use Tableau Prep to track account balance history from Mint.
Histórias relacionadas

How Team USA uses data to build a digital HQ
 8 Fevereiro, 2022

Tendências de dados que causarão impacto em 2022
 3 Fevereiro, 2022

Healthcare Analytics Hub Starter Kit: Get the data you need faster
 18 Outubro, 2019
The purpose of the Healthcare Analytics Hub Starter Kit is to provide a sample of what your healthcare app could look like. It’s not a complete solution; instead, it’s focused on what’s possible. Please contact your Tableau Account Manager to get started today!
Subscribe to our blog
Receba em sua caixa de entrada as atualizações mais recentes do Tableau.