Empowering a Data Culture to drive change at Tableau Conference 2019


Changing the world with a community that's one in a million
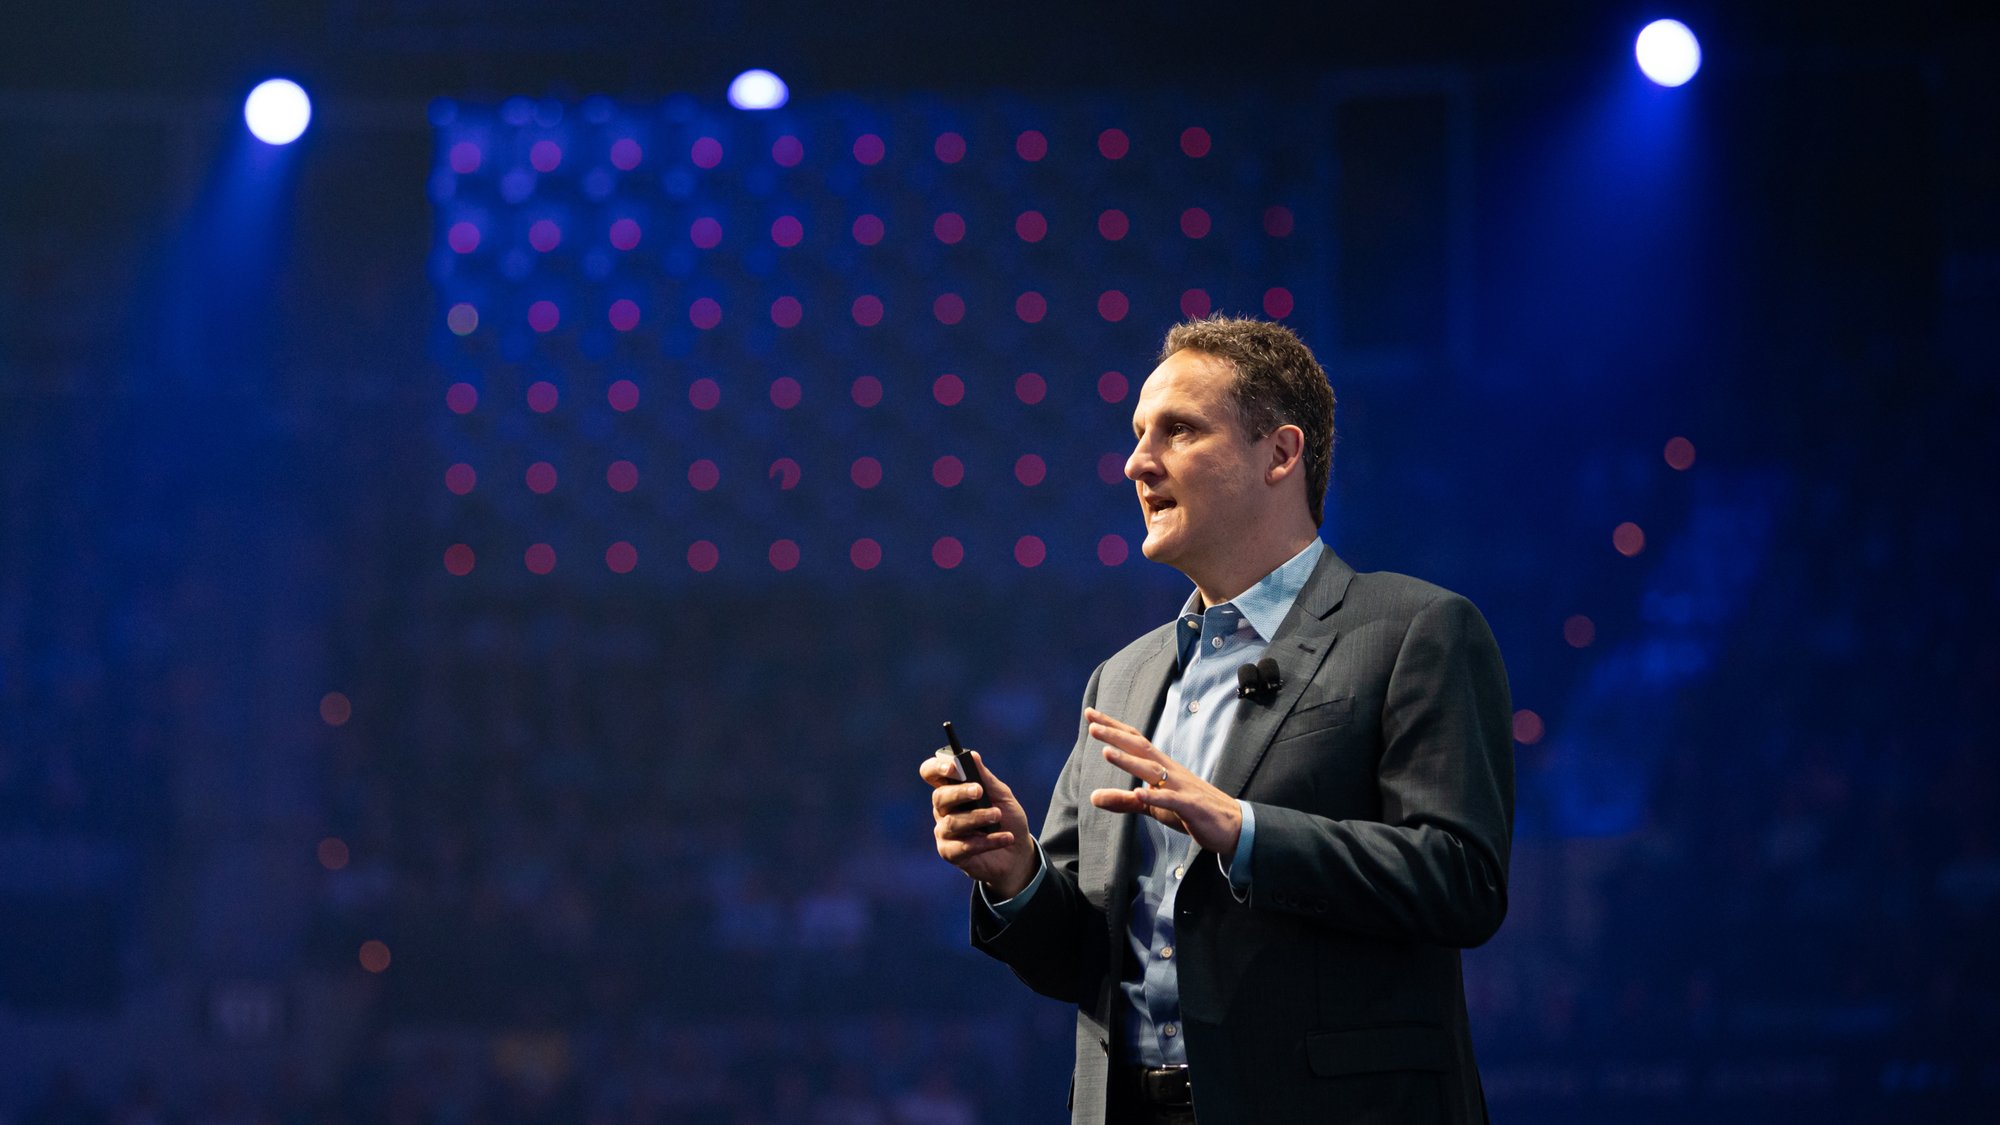
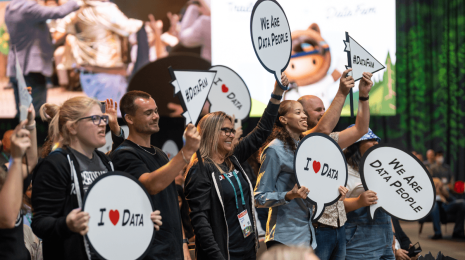
This morning in Las Vegas we kicked off our 12th annual Tableau Conference—our biggest yet, with data rockstars from all over the world! (Don’t miss out just because you can’t make it—you can watch along via Tableau Conference Live!)
CEO Adam Selipsky began the opening keynote energized by the growth of the Tableau Community—now more than one million people strong!—and the powerful ways people are using data to change the world and improve lives.
Adam was thrilled to announce that through Tableau Foundation, we’re expanding our partnership with Splash to bring clean water to one million children in two of the world's largest cities by 2023. Five-time Tableau Zen Master and CEO of DataBlick, Anya A’Hearn, shared how in her personal and professional growth she used her visual voice to advocate for those without one—including young women through her work with Splash.
We are blown away by our community doing good with data every day. One great place where we get to see it come to life is Tableau Public, which hosts more than two million vizzes viewed over 2.3 billion times. We’ve also had incredible momentum with Tableau Academic programs, surpassing one million lifetime activations of student and instructor licenses. With Tableau in the classroom, we’re raising a new generation of data natives ready to come into the workplace to create impact.

We also had a guest appearance from Chairman, Founder, and Co-CEO of Salesforce, Marc Benioff. He and Adam talked about the parallels between the core values and amazing communities of Salesforce and Tableau. Feeling the "beautiful energy in this room, coming from the community," Marc explained how our culture will always transcend our technology, and why it's important we continuously commit to our stakeholders—our customers, partners, employees, and the communities within we operate. Finally, Marc and Adam shared a customer-centric vision for the future of Tableau, accelerating our innovation as we remain focused on our mission to help people see and understand data. Oh, and let’s not forget, he asked the Tableau Community to weigh in on Twitter—what should our Salesforce character be?
Building a Data Culture with a proven Blueprint
Data is at the heart of changing the world, but to make the most of its transformative potential—and to reach analytics ubiquity—organizations must succeed in building a culture of data. Adam explained that the idea of a Data Culture is not new. In fact, that the elements for a successful modern data culture are also present in a triumphant and true story—one that took place during World War II, when young women were recruited by the US government to break the codes of encrypted enemy transmissions.

We were fortunate to have bestselling author Liza Mundy in the audience, whose book Code Girls uncovered this powerful and previously untold story. The codebreakers were pivotal in disrupting enemy supply efforts in the Pacific, ending U-boats’ control of the Atlantic, and cementing the exact landing spot for the D-Day invasion. And as Adam explained, these women fostered a Data Culture that changed the course of history.
Now we’ve cracked a code as well—to building a successful Data Culture. Tableau Blueprint is the culmination of everything we’ve learned about what works and what doesn’t in creating a data-driven organization. It combines the expertise of thousands of our most successful customers with best practices from our nearly two decades spent disrupting the analytics industry.

Tableau Blueprint provides step-by-step guidance to building the critical capabilities of today’s data-driven organizations—agility that empowers collaboration without sacrificing security; proficiency through data literacy at all levels of analytics sophistication and complexity; and community that empowers and celebrates the use of data for decision-making. We understand that it takes more than the right software to build a culture of data, and Tableau Blueprint is how we’re helping customers do it.
To tell us about the thriving data culture at Nissan, North America data officer Danielle Beringer took the stage. Reimagining their engagement strategy and establishing company-wide data literacy, Nissan built new bridges across their teams to evolve their customer relationships, digital business, and Data Culture in every Nissan and Infiniti dealership in America. Tableau has helped the organization to optimize in-plant operations, logistics, and shipping; to mine telematics and repair data to improve vehicle performance, quality, and safety; and to support the customer journey—both online and at dealerships.

Expanding our analytics platform to empower a Data Culture
Next, Chief Product Officer Francois Ajensat and members of our dev team showed off our latest innovations—including new data management capabilities, augmented analytics with natural language and AI, and features to further enable personalization, discovery, and deeper engagement with your data.

Advancing self-service data management
Graeme Britz, a senior product manager, showed the audience how our new data management offering is getting supercharged with new capabilities. Next year, Tableau Prep Builder will offer the ability to write back to relational databases! And Tableau Prep Builder is coming to the browser, with all the same functionality as the desktop app. These exciting updates mean more flexibility in how and where to share your prepped data, and even simpler deployment and governance for IT.

Graeme explained how the new Tableau Catalog helps IT better manage the proliferation of data sources and analytical content while bringing critical metadata directly to your people. Now all of your users can more easily find the data they need for analysis, understand where it came from, and have confidence its quality. Plus, Catalog integrates with other enterprise metadata management solutions, allowing for even greater visibility and discoverability.

Powering analytics with AI in Ask Data, Explain Data
Samantha Kwok, a senior engineering manager, demonstrated how Tableau is making analysis faster and simpler with more powerful natural language capabilities in Ask Data, and how the brand-new Explain Data is helping customers move from what happened to why it happened.

With a click, Explain Data runs dozens of sophisticated algorithms to surface possible explanations with statistical significance—each as a viz that can be explored further! In a dataset about a vehicle trade-in program, Explain Data surfaced some insight into the state of Montana’s love for pricier trucks, and helped Samantha discover a potential data entry error in a single outlier.
Samatha showed off the true horsepower of Ask Data, creating a calculation to see which states in the trade-in program improved fuel efficiency the most. Previously, this would require adding a calculation to the underlying data model. Now it’s fast and easy on the fly—as simple as typing “MoM” for month-over-month analysis. Additionally, we’re bringing Ask Data to other applications and web portals with the ability to embed our powerful natural language interface using a simple code!
Increasing people’s engagement with data and analytics
Ann Ho, a senior product manager, showed us how Tableau is bringing a more personalized experience to users. Ann announced Metrics—coming next year, you can easily create and track key performance indicators from various dashboards, and see all of them at a glance in a consistent format.

Metrics is optimized for Tableau Mobile, allowing you to see changes over time with a quick tap, investigate peaks or valleys while scrubbing over a timeline, and seeing if a certain trend is something you should act on through “filter and compare.”

Metrics will build on the personalization capabilities we added with the new, machine learning-powered View Recommendations, where Tableau surfaces trending vizzes and makes recommendations for new vizzes based on similar users’ actions.
The future of analytics starts now
Since TC18, we’ve added more than 200 new capabilities to the platform across five new versions of Tableau! We’re accelerating our innovations to help organizations build a thriving data culture—to analytics ubiquity!—but we can’t do it without the support of our amazing community. We need you to continue to share your passion, creativity, and feedback to help us to shape and fine tune the Tableau platform so you’re empowered to change the world with your data.
Want to be among the first to try new features and provide valuable feedback that guides our development? Join our pre-release program today!
See more with Tableau Conference Live
If you aren’t with us in Las Vegas, you can join us via Tableau Conference Live! We’re not only streaming the crowd-pleasing Devs on Stage and Iron Viz keynotes, but also hand-selected sessions from customers and Tableau experts, exclusive interviews with members of the Tableau Community, and plenty of surprises.
Histórias relacionadas
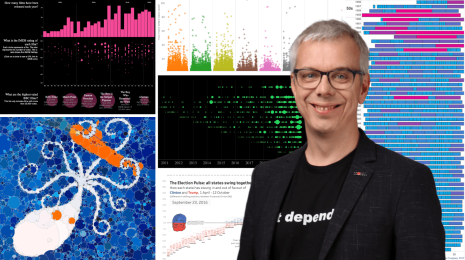
My Tableau Story: Andy Cotgreave
 16 Março, 2024
How Tableau Features the Power of Data and Generative AI at Gartner BI Bake-Off
12 Março, 2024
5 Reasons Why Data Pros—Like You—Should Attend Dreamforce
 11 Julho, 2023
Subscribe to our blog
Receba em sua caixa de entrada as atualizações mais recentes do Tableau.