Prepare survey data for analysis with three easy steps


Update: Tableau Prep is here! Read this blog for the latest tips.
Survey data is notoriously tricky. As a Tableau product consultant, I’ve come across survey data in all forms and circumstances—from large-scale surveys in fully-fledged market research organizations to smaller internal surveys within my team. There is always a common challenge—properly structuring this data for analysis in Tableau.
In this blog post, I’ll walk you through some steps on how to reshape survey data for easier analysis in Tableau. You can also walk through these steps in more detail with the workbook below:
Step 1: Pivoting your survey data
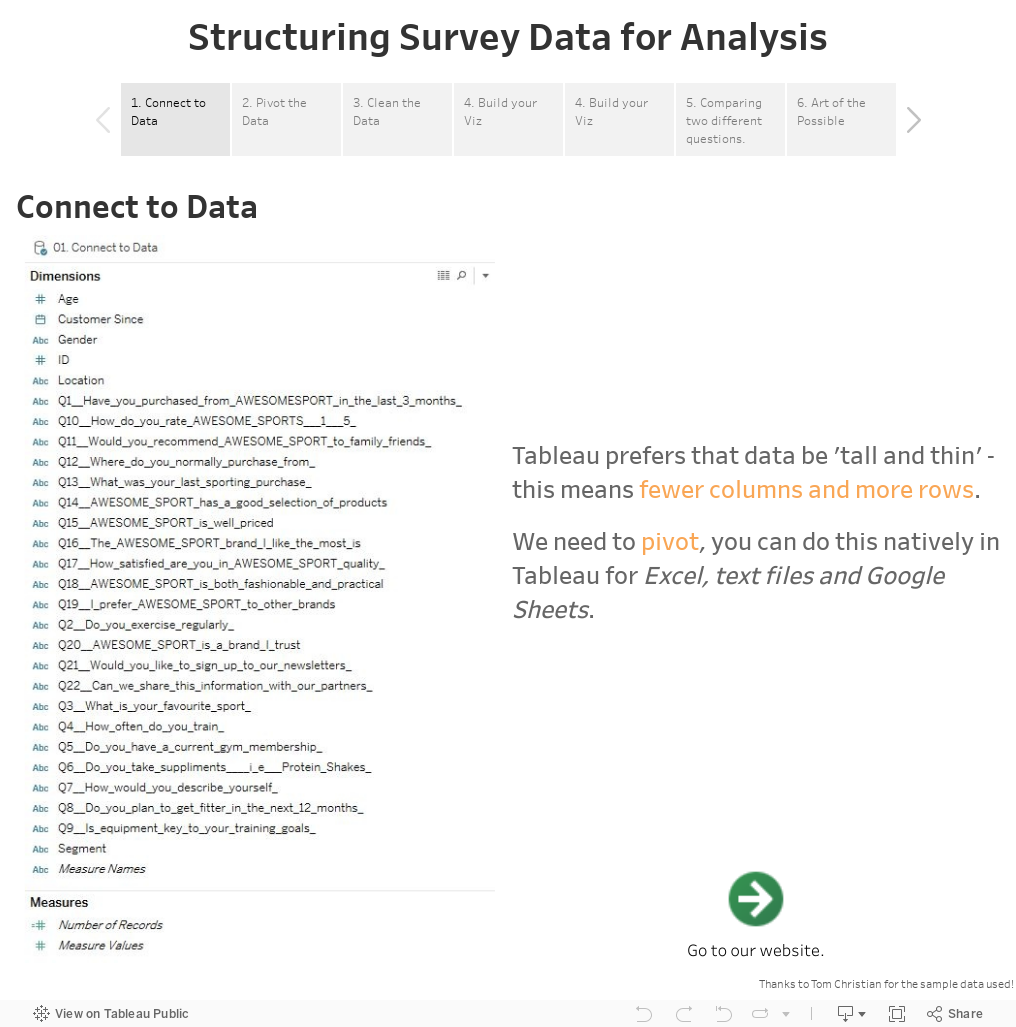
Typically, survey data is formatted so that each row corresponds to an individual respondent and a column for each question. This results in what we like to call ‘short and fat’ data, where we only have as many rows as respondents, but many columns for all the questions. However, Tableau prefers that data be ‘tall and thin’. To adhere to this preference, we need to pivot the data so that we’ll have fewer columns and many more rows.
When you pivot your data, you want to keep any dimensions—that is, the fields you want to ‘slice and dice’ by—out of the pivot so that they are stored as separate columns independent of ‘Questions’. With survey data, this tends to be any demographic information about your respondents. For example, age, gender, country, etc.
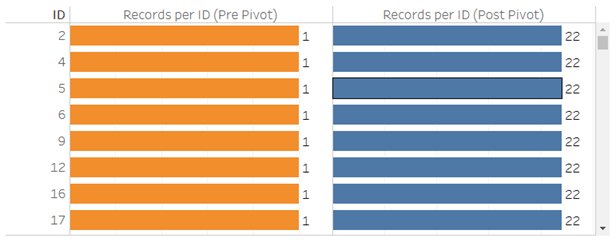
This results in your many columns being converted into just two ‘Pivot Field Names’ (renamed to Questions) and ‘Pivot Field Values’ (renamed to Responses). This multiplies the number of rows that were originally in your data source by the number of questions included in the pivot. Now, each row in the data set corresponds to one question per respondent.
There will often be ‘null’ responses, meaning a respondent didn’t answer the question. You should apply a data source filter to exclude these so that every record corresponds to an answered question per respondent.
You can learn more about pivoting your data in Tableau with this Quick Start Guide.
Step 2: Cleaning your data for analysis
After pivoting the data, the hard work is over! Now it’s just a matter of cleaning up the data so that analysis is as easy as possible.
One of the first steps I always take is to duplicate the response field and change the data type to numeric. This will convert any numeric response keys (like ratings) to measures. This makes it easier to do a variety of things, like computing averages, for example.
Another step is to group the questions that have similar answer keys (like ratings questions, Likert scale, yes/no, etc.). This makes it simpler to analyze questions of the same type by using the field ‘Question Type’ and ‘Questions’ on the filters shelf.
Step 3: Start analyzing your survey responses
As soon as the data is in the right shape for analysis in Tableau, it becomes incredibly easy to build different kinds of visualizations and interact with them in a dashboard. With one click on ‘use as filter’, a viz will instantly become a filter for the rest of the dashboard; and with quick filters, you can chop and change the question you’re viewing responses for.
Play around with this completed dashboard:

Anyone working with survey data should be especially excited about Project Maestro, Tableau’s new, visual and direct approach to combining and cleaning your data. You can download the beta here.
New to Tableau?
No problem. Tableau has plenty of free training videos that can help you learn the skills you need to build effective vizzes and communicate your data clearly. Happy vizzing!
Histórias relacionadas

How Team USA uses data to build a digital HQ
 8 Fevereiro, 2022

Tendências de dados que causarão impacto em 2022
 3 Fevereiro, 2022

Healthcare Analytics Hub Starter Kit: Get the data you need faster
 18 Outubro, 2019
The purpose of the Healthcare Analytics Hub Starter Kit is to provide a sample of what your healthcare app could look like. It’s not a complete solution; instead, it’s focused on what’s possible. Please contact your Tableau Account Manager to get started today!
Subscribe to our blog
Receba em sua caixa de entrada as atualizações mais recentes do Tableau.